License: proprietary — MomentumQ GmbH · © MomentumQ GmbH
1. Core Concept
MoQ Combo is built to answer three things for you, in real time:
- Are we in a bullish, bearish, or neutral momentum state?
- Are we approaching exhaustion (overbought / oversold) or just entering momentum?
- Are there early warning signs (like divergence) that the current move is weakening?
Instead of guessing based on a single oscillator line, MoQ Combo presents:
- Regimes (context)
- Signals (timing)
- Extremes (risk of reversal)
- Momentum bias (which side currently has control)
This structure is designed to help both breakout traders and mean-reversion traders.
2. RSI & Market Regime View
The first layer is a classic RSI (Relative Strength Index). MoQ Combo uses RSI to identify broad regime conditions, not just "above 70 = sell".
RSI Regime Classification
MoQ Combo classifies RSI into:
- Bullish regime: RSI is holding in a constructive zone (roughly above ~50 but not overheated), and remains supported over multiple bars.
- Bearish regime: RSI is holding in a weaker zone (roughly below ~50 but not fully washed out), and remains suppressed over multiple bars.
- Neutral regime: None of the above.
On the chart:
- RSI can be colored green during bullish regime conditions.
- RSI can be colored red during bearish regime conditions.
- Otherwise, it defaults to a neutral tone.
You can also optionally display fixed RSI guide levels: 70 (overbought reference), 30 (oversold reference), 50 (midline).
This gives you a fast read: "Are we being accumulated, distributed, or just ranging?" and "Are we extended, or are we stabilizing?" This is especially useful for swing bias and directional filtering.
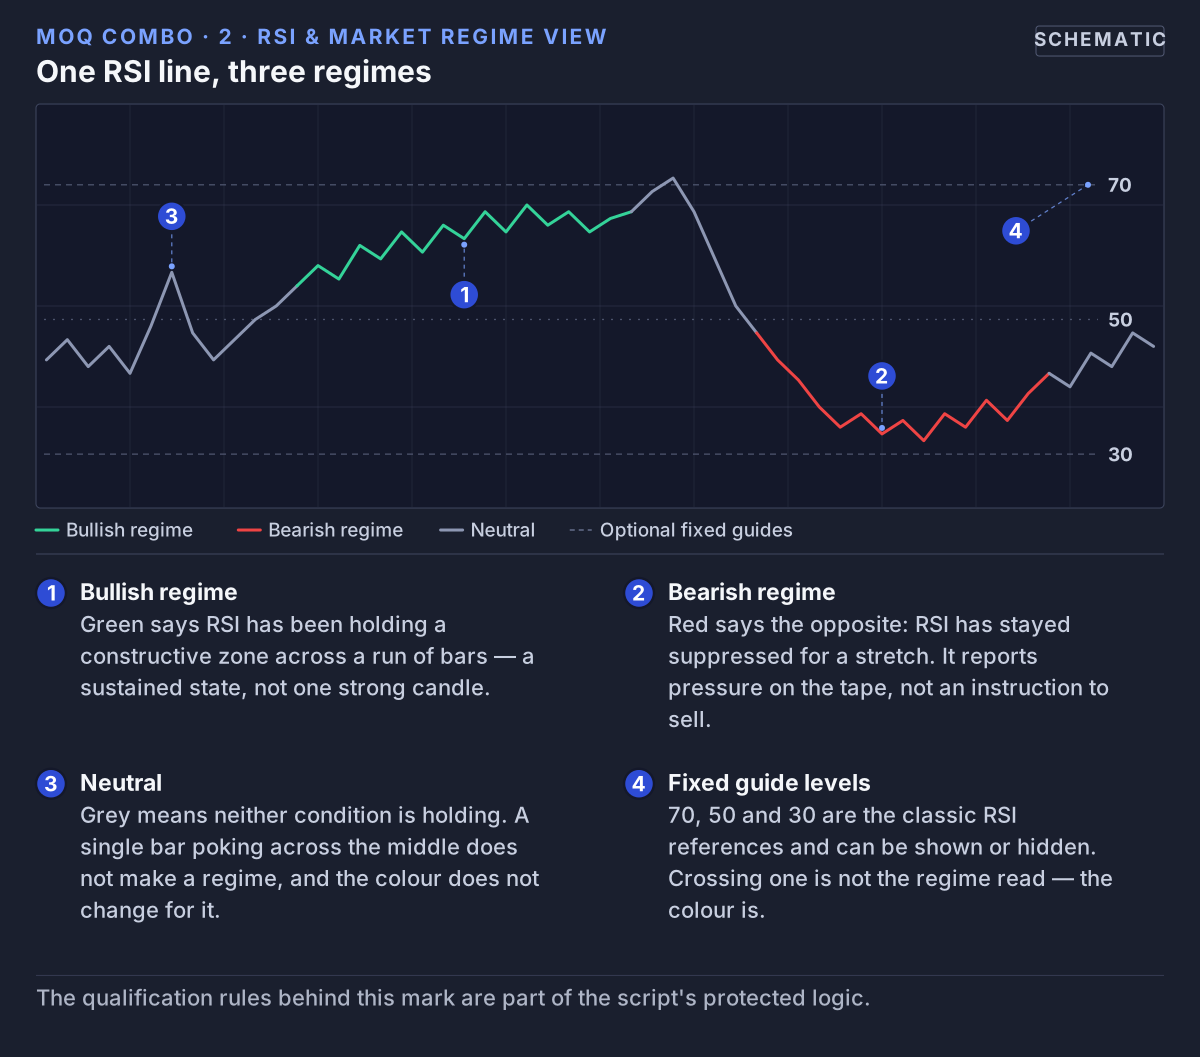 The RSI line is recoloured by the regime it is holding, so context is read from the colour rather than from a threshold cross.
3. Stochastic RSI Timing Layer
The second layer applies a Stochastic calculation to RSI itself (often called "Stoch RSI"). This is used to time turns inside the broader regime.
MoQ Combo calculates a smoothed %K and %D of RSI, and optionally plots:
- %K line (faster)
- %D line (slower average of %K)
- Overbought / oversold bands (commonly 80 and 20, plus 100 and 0 hard caps)
- A shaded background between the OB/OS bands for instant visual reading
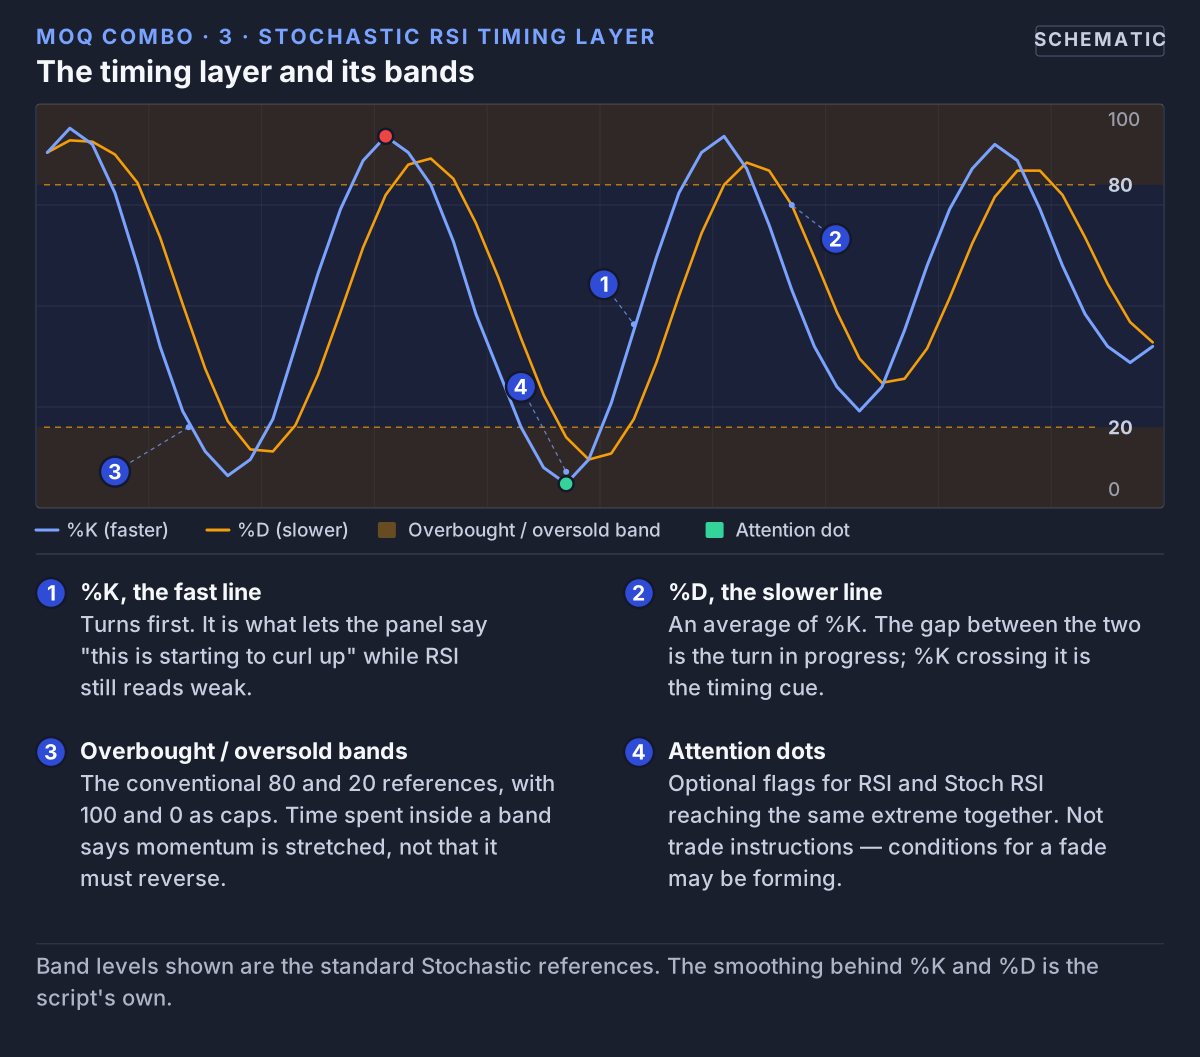 The Stoch RSI layer times turns inside the regime: %K leads, %D confirms, and the shaded bands mark where momentum is stretched.
Why This Matters
- RSI alone might say "we're weak."
- Stoch RSI can say "we are just starting to curl up from oversold," which is often the first sign of a bounce.
- Or vice versa near tops.
Simple Illustrative Signal Markers (Optional)
The script can plot basic dot markers when:
- Bullish condition: RSI and Stoch RSI both reach deep oversold territory together (possible early accumulation / oversold attention area)
- Bearish condition: RSI and Stoch RSI both reach deep overbought territory together (possible distribution / overbought attention area)
These are not trade instructions. They're flags that conditions for mean-reversion or fading may be forming.
4. Divergence Detection
MoQ Combo can attempt to detect both regular and hidden divergence between price and the Stoch RSI %K line.
It does this by:
- Finding pivots (swing highs / swing lows) in %K.
- Finding pivots in price at the same bars.
- Comparing whether price made a higher high while %K made a lower high, etc.
It draws lines between recent pivots and colors them:
- Bearish divergence (price up, momentum down)
- Bullish divergence (price down, momentum up)
- Hidden divergence (trend continuation setups)
This feature can be toggled on/off. It's especially useful for spotting early fade areas or continuation exhaustion.
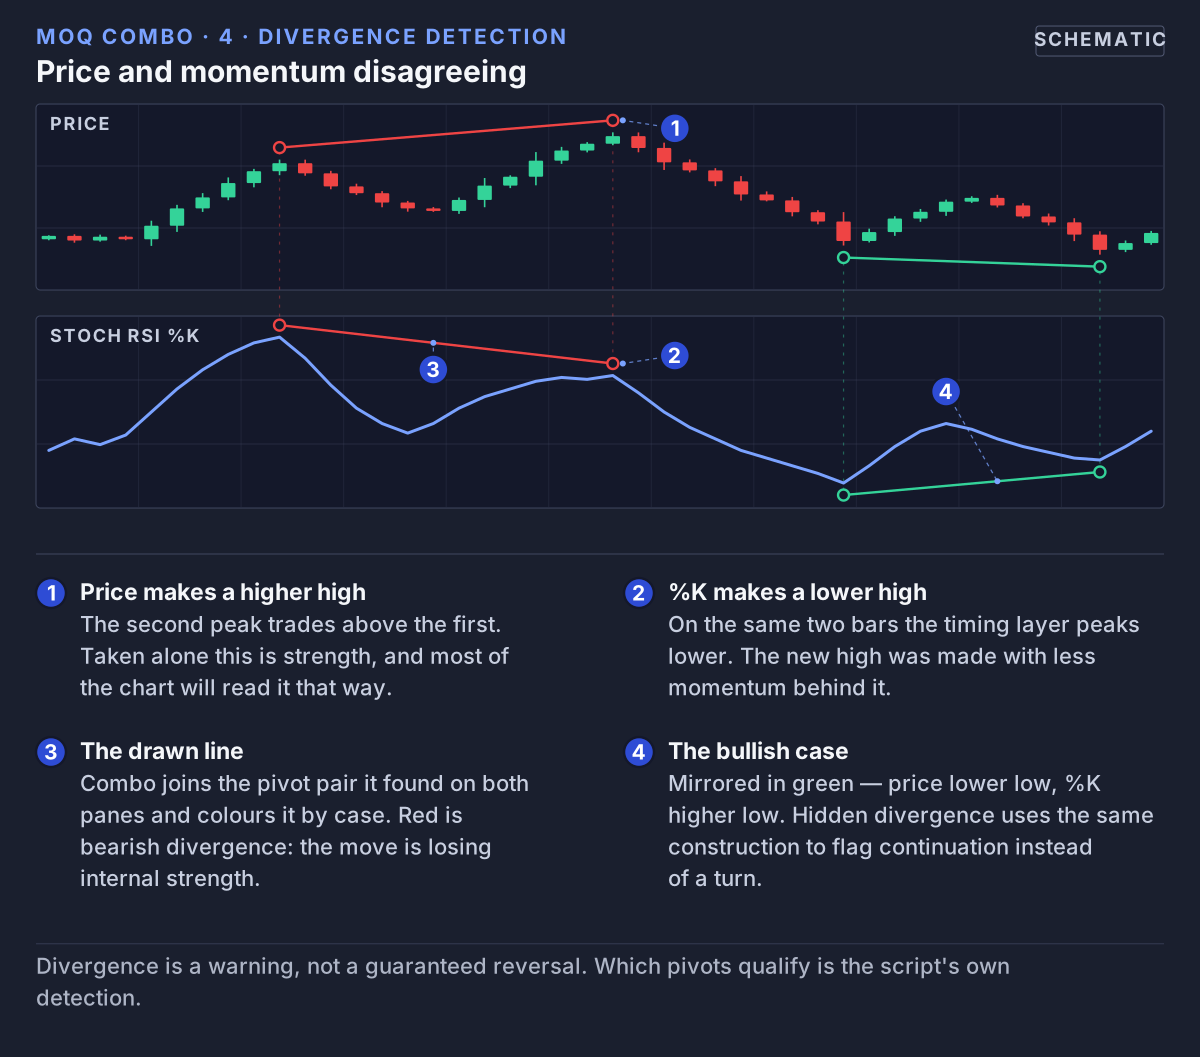 Divergence compares pivots on the same bars: price and %K pointing opposite ways is the whole signal.
Note: Divergence is a warning, not a guaranteed reversal. Higher pivot length = fewer but stronger divergence calls. Lower pivot length = more signals, but they can be noisy.
5. Momentum Tracker
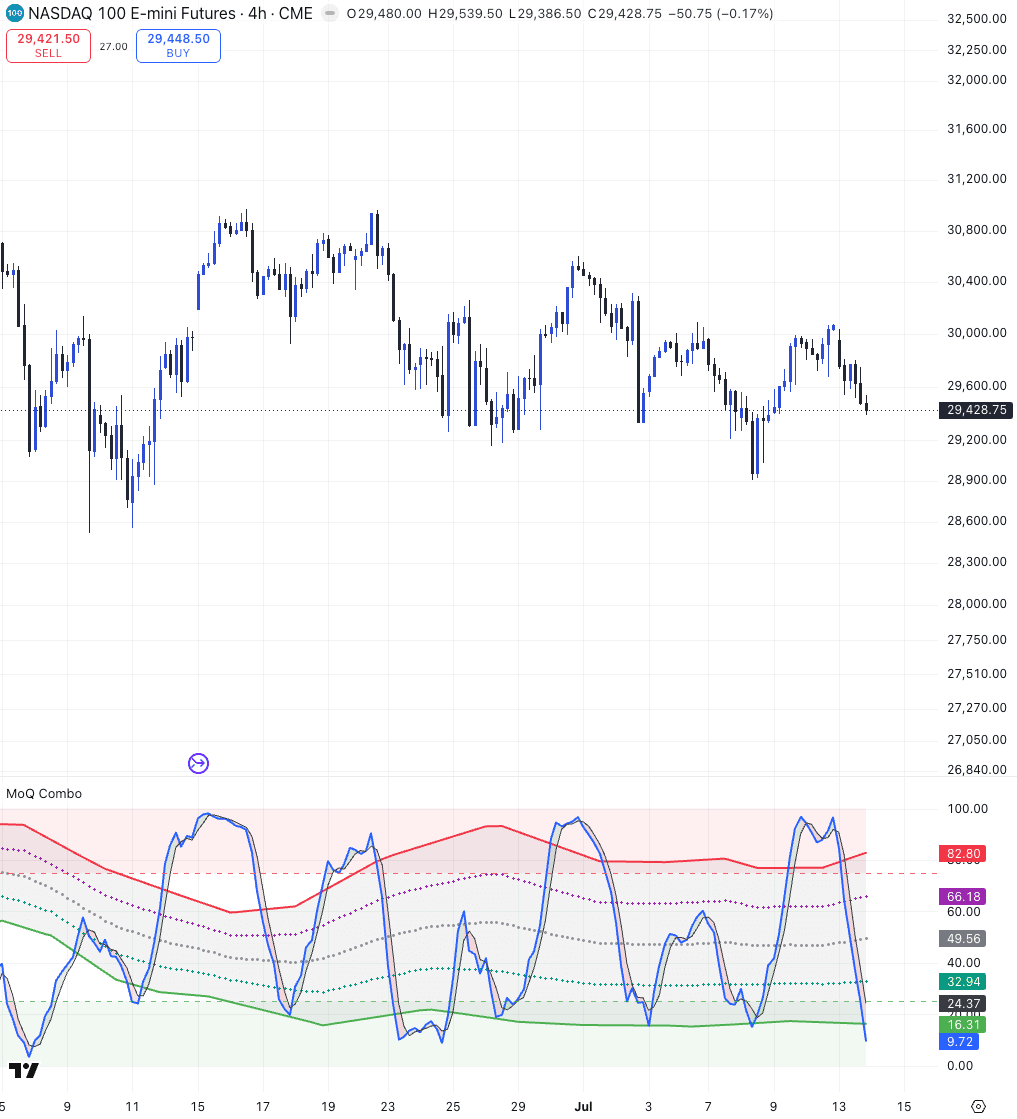
Momentum Tracker is the advanced momentum engine inside MoQ Combo.
When enabled in Settings → Momentum Tracker, it replaces the standard oscillators with a specialized Stochastic (%K/%D) of price and a full adaptive structure framework. Starting with V2.2, you can choose between Histogram Mode and Line Mode for how the %K/%D engine is displayed.
Display Options
1. Histogram Mode
- Plots momentum as a histogram around the 0-line
- Makes expansions and contractions extremely easy to see
- Ideal for traders who like fast visual cues
- Helps spot acceleration/deceleration immediately
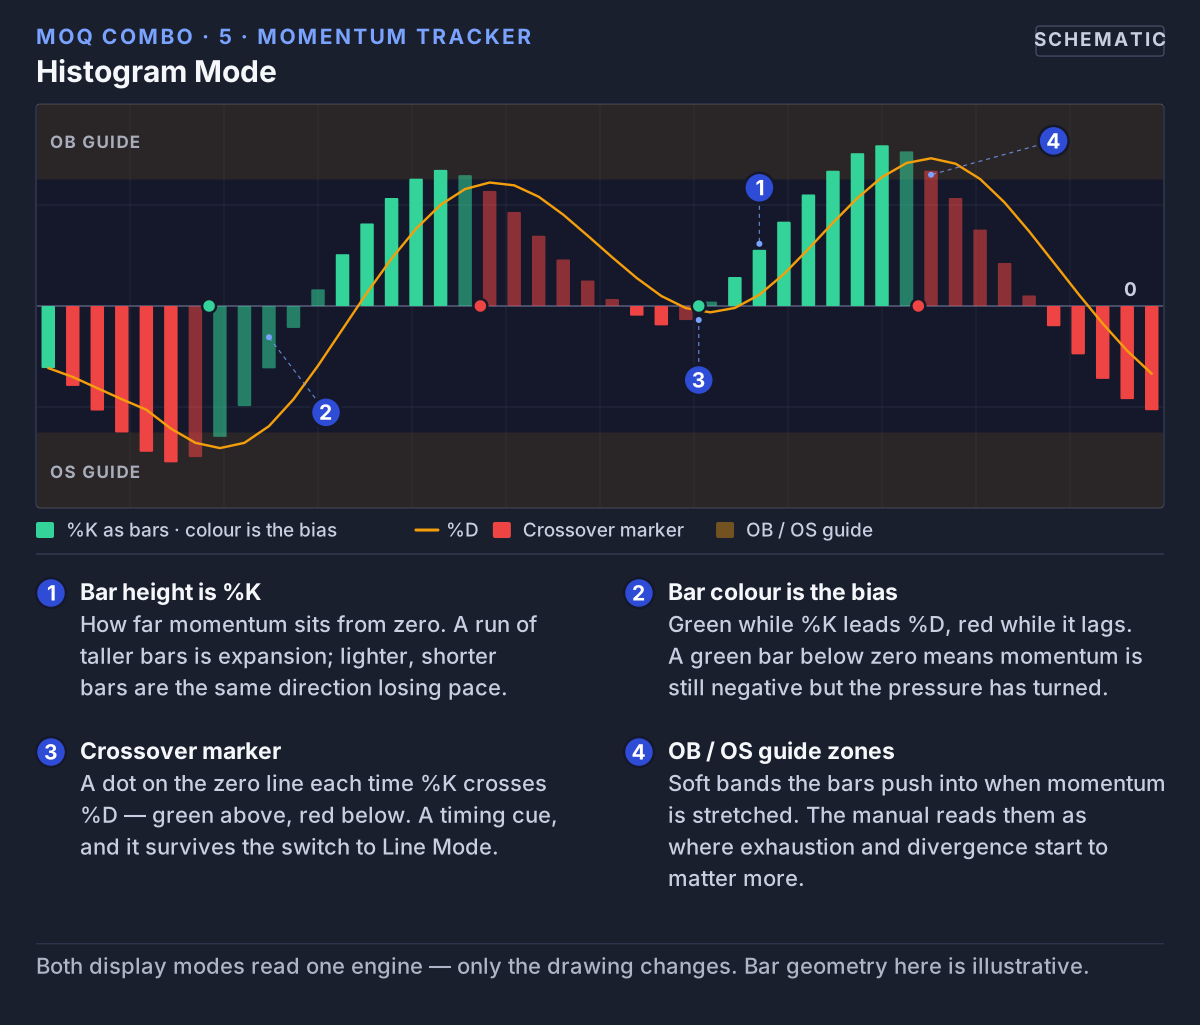 Histogram Mode draws %K as bars around zero, so expansion and contraction of momentum is the first thing you see.
2. Line Mode
- Traditional %K/%D line-style oscillator
- Best for spotting crossovers, sweeps, and micro-shifts
- Good for traders who prefer cleaner swings
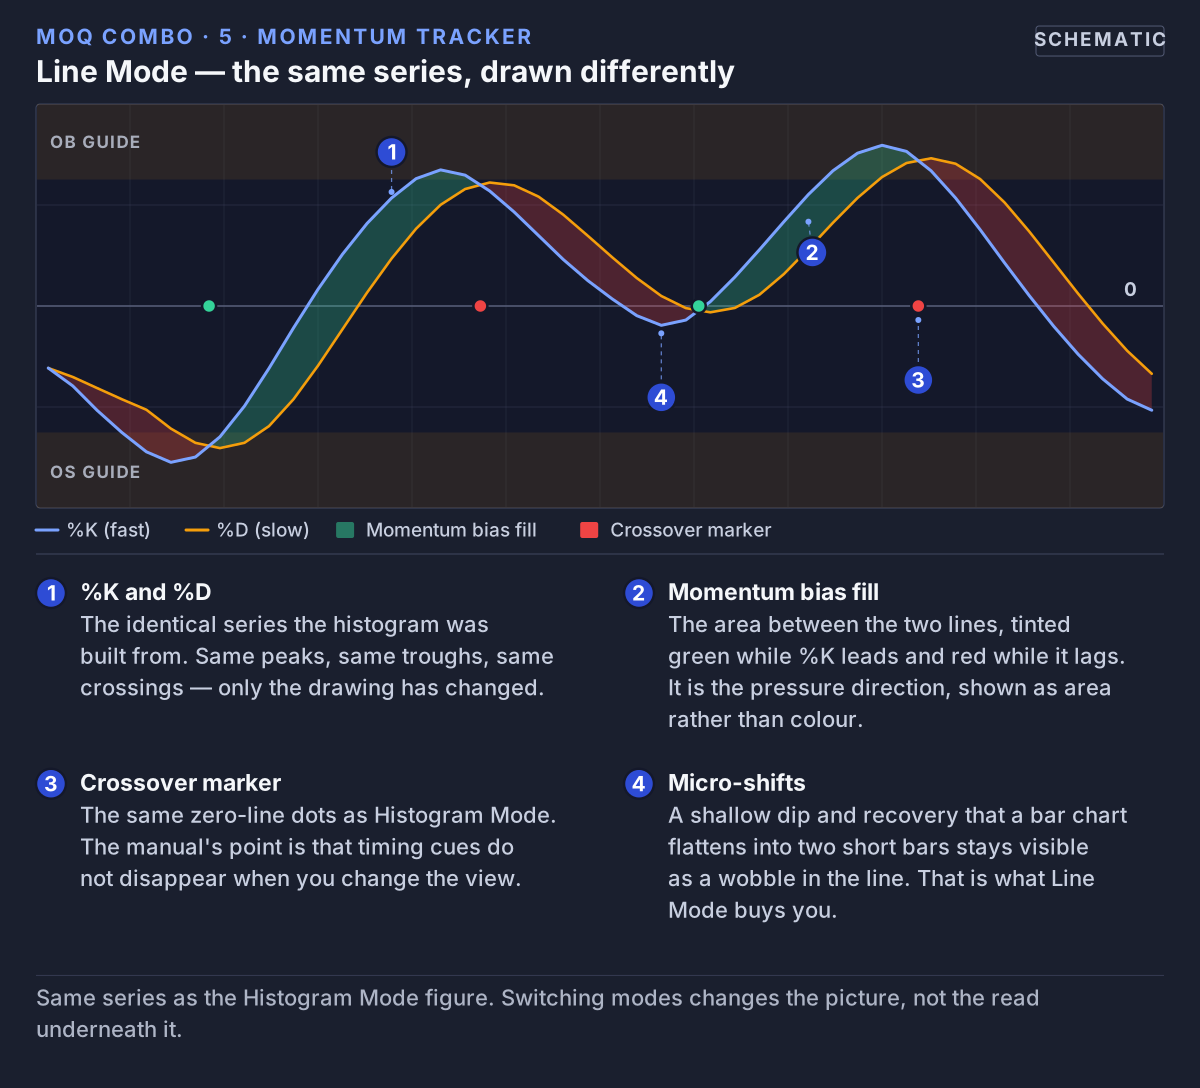 Line Mode plots the same %K and %D as lines. Nothing in the calculation changes — crossovers and micro-shifts simply read more clearly.
You can switch between the two at any time — they use the same underlying logic, only visualized differently.
a) %K / %D Core — Momentum Engine
Momentum Tracker generates a smoothed %K and %D using a custom price-based Stochastic system.
Crossovers
Both modes (Histogram + Line) include crossover markers at y = 0:
- Green → %K crosses above %D (bullish shift)
- Red → %K crosses below %D (bearish shift)
These markers appear even in Histogram Mode, ensuring timing cues stay visible regardless of display choice.
b) Pivot Framework — Adaptive Momentum Structure
Works with both display modes:
- Detects pivot highs/lows in %K
- Averages them
- Draws adaptive high/low bands, mid bands, and a mean line
- Soft shading creates a "momentum corridor"
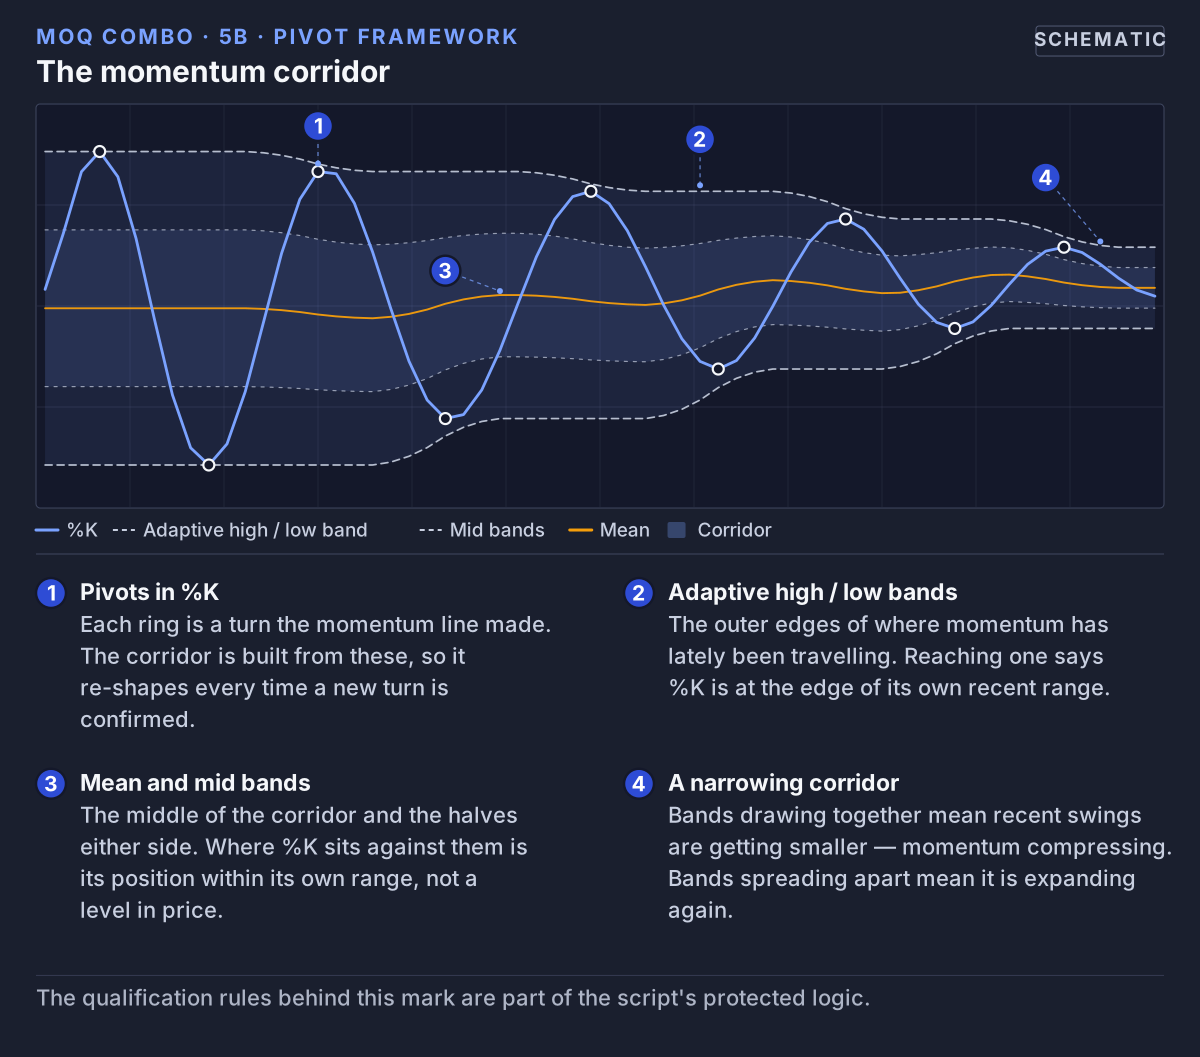 Turns in %K are collected into adaptive bands. The shaded corridor between them is where momentum has recently been trading.
c) OB/OS Zones — Soft Overbought/Oversold Guides
Soft semi-transparent zones above/below the corridor help identify:
- Potential exhaustion
- Where reversals often occur
- Areas where divergence matters more
d) Momentum Bias Fill — Pressure Direction
Momentum bias is shown even when using Histogram Mode:
- Green-tinted fill when %K > %D
- Red-tinted fill when %K < %D
This ensures pressure direction is readable no matter which visualization style you choose.
6. Theme Support (Light / Dark)
MoQ Combo includes a Theme Settings group. You can pick Light Mode or Dark Mode.
The script adjusts line colors, highlight colors, and text contrast so it remains readable and doesn't wash out on your chart. This applies across RSI regime coloring, Stoch RSI lines, Momentum Tracker pivots and fills, and OB/OS zones.
7. How to Use MoQ Combo in Practice
A. Classic Momentum Read
- Turn on RSI Regime and RSI Stochastic.
- Watch for RSI to enter and hold a bullish regime (green).
- Watch Stochastic RSI curl up from oversold while RSI is still relatively low.
→ This can mark early accumulation.
Reverse that logic for bearish cases: RSI in a bearish regime, Stoch RSI curling down from overbought while RSI is still elevated. → Potential distribution / exhaustion.
B. Divergence Check
If you enabled divergence:
- Bearish divergence near the top of a rally can warn "this move is losing internal strength."
- Bullish divergence after aggressive selling can hint "sellers are tiring."
This is signal context, not an entry by itself.
C. Momentum Tracker
For more structure:
- Enable Momentum Tracker.
- Use the pivot bands to understand where momentum is trading relative to its own recent range.
- Watch the color fill between %K and %D:
- Sustained green fill + repeated bullish crosses near the lower half of the range = constructive momentum build.
- Sustained red fill + repeated bearish crosses near the upper half of the range = distribution / sell pressure.
- Use the crossover markers at y = 0 as timing cues. These are often where intraday traders choose to engage or exit partials.
D. Strategy Integration
MoQ Combo is not a "buy here / sell here" system. It's a timing and context assistant that you add on top of:
- Higher timeframe bias
- Key price levels (support/resistance, liquidity pools)
- Risk management rules
You remain responsible for trade entries, exits, and size.
8. Customization
You have control over:
- Theme: Light Mode / Dark Mode
- RSI Layer: Show or hide RSI regime coloring, keep or hide classic 70/30 lines
- Stochastic RSI: Toggle display, adjust smoothing lengths, OB/OS shading, optional signal dots
- Divergence: Enable/disable detection, control pivot sensitivity
- Momentum Tracker: Toggle on/off, tune %K/%D lengths and smoothing, set pivot averaging, show bands/midpoints/shaded ranges, view OB/OS guide zones, momentum bias fill, crossover markers
This modular design means you can run Combo as a lightweight RSI/Stoch RSI panel, or a full-featured momentum dashboard with adaptive pivots.
9. Access
MoQ Combo is a proprietary MomentumQ GmbH script and may be distributed as an invite-only or controlled-access script on TradingView. If access is restricted:
- Go to the MomentumQ profile on TradingView.
- Click "Message".
- Include your TradingView username and intended usage (scalping, swing, etc.).
TradingView recommends that you only pay for or rely on private scripts from authors you trust and whose logic you understand. You can always explore public, open-source indicators as well.
10. Disclaimer
The MomentumQ Combo (MoQ Combo), including all visuals, alerts, divergence logic, regime classification, and momentum tools, is provided strictly for educational and informational purposes. It is not financial advice, investment advice, trading advice, or a guarantee of performance.
All forms of trading and investing carry risk, including the risk of loss. Past performance is not indicative of future results.
You are solely responsible for any decisions you make in the market. You should use proper risk management, and you may wish to consult a licensed financial professional before acting on any signal or interpretation from this tool.
© MomentumQ GmbH. All rights reserved. Provided for personal, non-transferable use under the MomentumQ Terms of Service; redistribution, modification, and source extraction are prohibited.