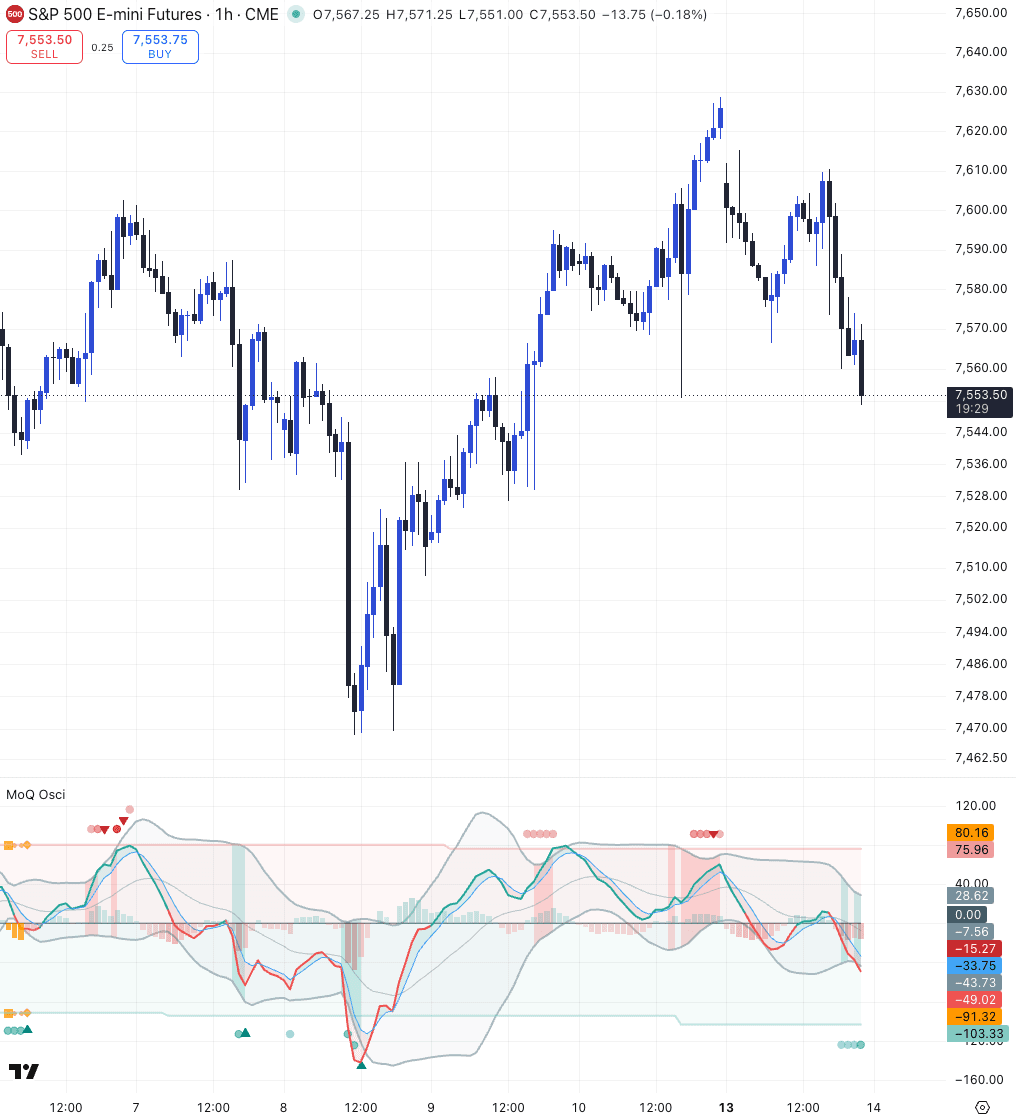
License: proprietary — MomentumQ GmbH · © MomentumQ GmbH
1. Core Concept
The MomentumQ Oscillator (MoQ Osci) is designed to help you read momentum, stress, and turning points in the market — with context. It focuses on four questions:
- Are we currently in bullish or bearish momentum?
- Are we pressing into overextended zones where reversals often form?
- Has an actionable trigger actually fired, or are we just approaching one?
- Is the current move "normal" for this market, or unusually extreme?
To answer this, MoQ Osci uses:
- A momentum engine inspired by MACD
- Adaptive bands around that momentum
- Dynamic reference zones that learn from recent behavior
- A volatility-adjusted trigger model
- Visual pre-signals and alert conditions
The goal is to help you understand pressure, timing, and conviction — instead of guessing from a raw oscillator line.
2. Scaled Momentum Engine
MoQ Osci uses a multi-line momentum core (a faster line, a slower line, and a signal line) and normalizes the output to a fixed reference scale.
Why Normalization Matters
- Different symbols, markets, and timeframes can produce very different raw oscillator values.
- Without normalization, "strong" on one chart may look "weak" on another.
- MoQ Osci automatically rescales its internal values so they appear in a consistent visual range.
That gives you relative context:
- "Is this extreme for this market right now?"
- "Is this move strong compared to recent history?"
- "Are we cooling off or accelerating?"
This makes it possible to compare different assets and timeframes more fairly. You don't need to manage the math. You just read the panel.
3. Adaptive Band Engines
Around the oscillator, MoQ Osci draws envelopes ("bands") that show where momentum is expanding into high-risk/exhaustion territory. You can choose between two band styles:
Option A: Classic Volatility Bands
- A center line that tracks the core oscillator
- Upper/lower envelopes that expand and contract with volatility
This is familiar if you're used to Bollinger-type behavior.
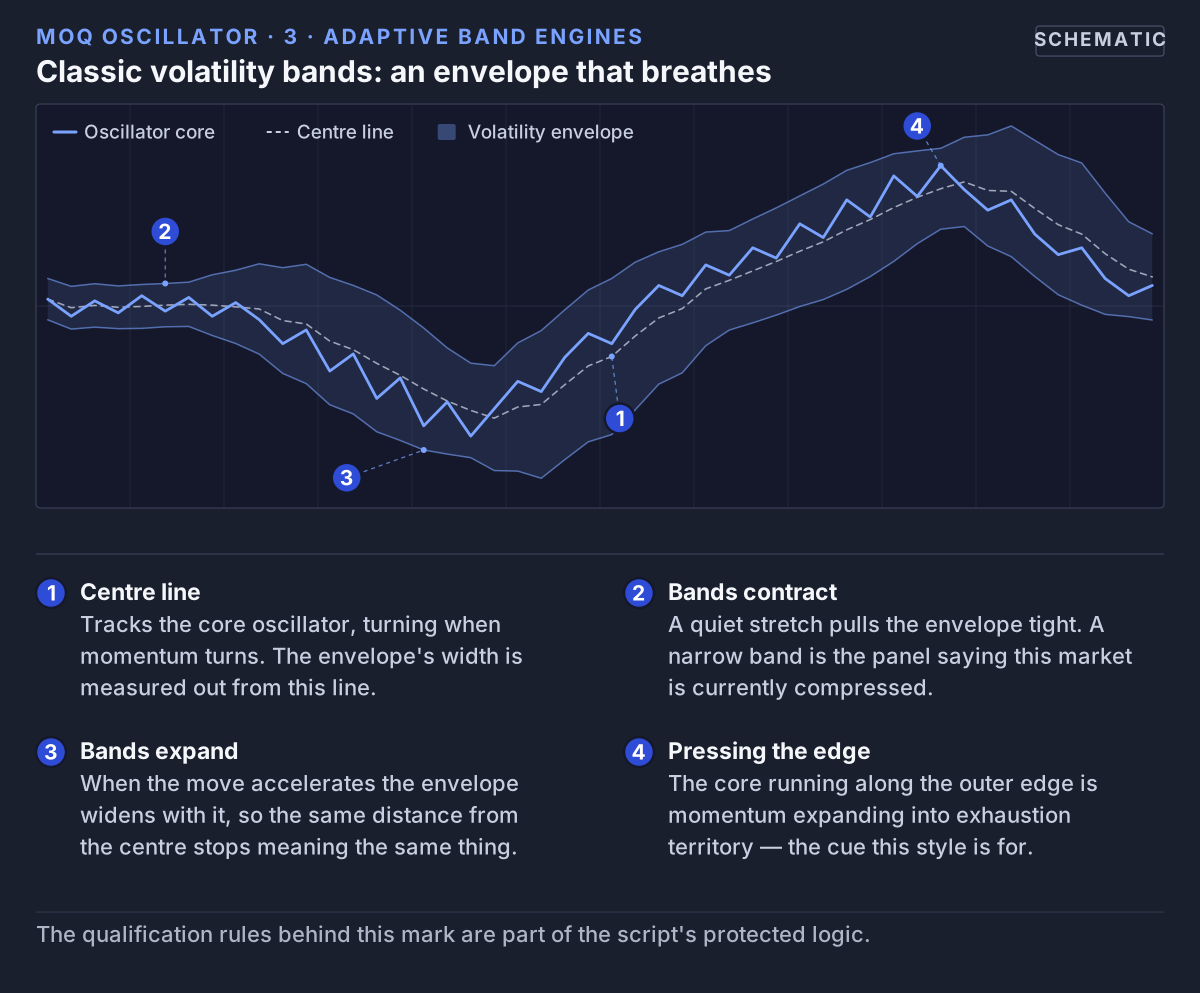 Classic bands: the envelope is measured out from a centre line that follows the core, and it breathes with volatility.
Option B: Adaptive Kernel Bands
- A smoother center line that reacts less to noise
- Envelopes based on how far the oscillator strays from that smooth baseline
- Optional adaptation to volatility conditions
This mode aims to show bias and stretch in a more fluid, noise-resistant way.
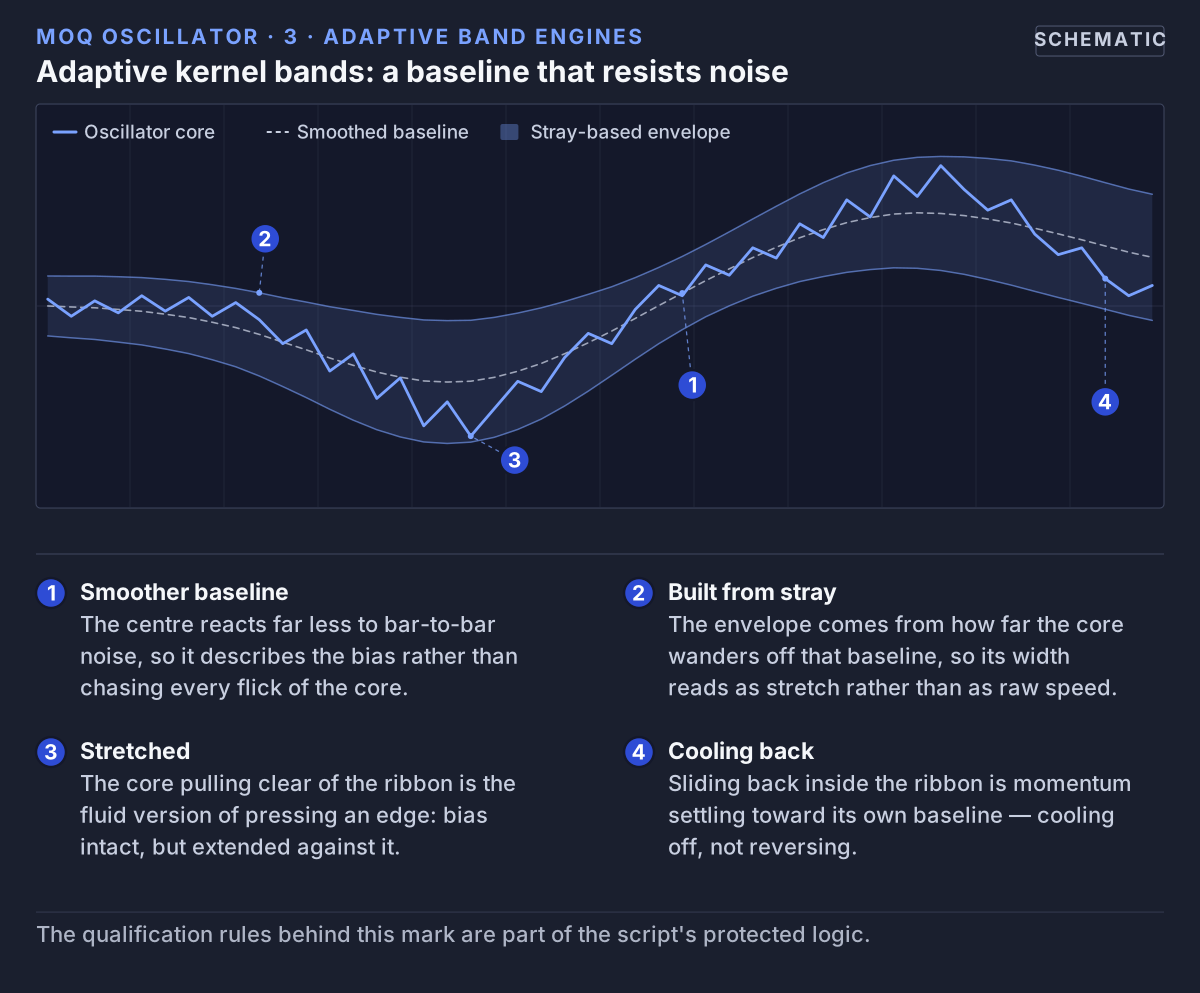 Kernel bands: the same series, a smoother baseline, and a ribbon whose width reads how far the core has strayed from it.
What You Get from Both
- You can visually see when momentum is pressing the "top edge" or "bottom edge."
- You can visually see when price is cooling off back toward its mean.
Those edges matter for timing exhaustion plays, continuation pressure, and potential reversals.
4. Dynamic Reference Levels
Traditional oscillators often assume fixed levels like "overbought at X / oversold at Y." That breaks down across assets. Some symbols live in a high-energy state; others almost never reach those levels.
MoQ Osci solves this by generating dynamic reference zones from the market's recent behavior.
In Plain English
- It studies where the oscillator has recently topped out and bottomed out.
- It builds adaptive "upper region" and "lower region" guides from that.
- It also derives middle reference zones between those extremes.
These levels are drawn directly on the panel, often with subtle shading. This gives you:
- A live sense of "this is stretched for this asset right now."
- A better feel for whether a move is standard pressure or outlier pressure.
- Awareness of when conditions are cooling back toward normal.
No guesswork, no hard-coded universal numbers.
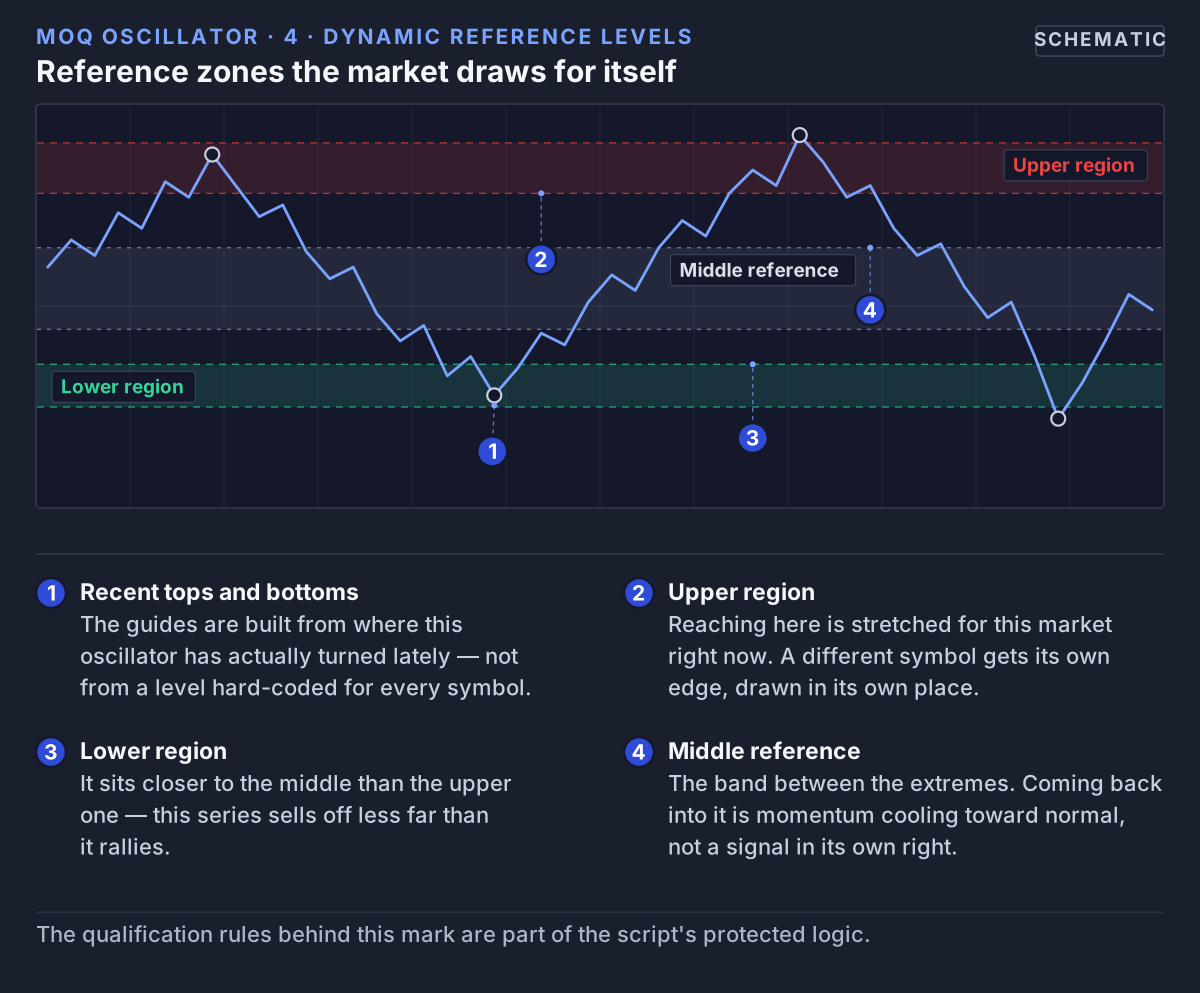 The regions are derived from where this oscillator has recently topped and bottomed, which is why they are not symmetric.
5. Trigger Logic (Buy / Sell Triggers)
MoQ Osci includes a trigger engine that looks at how far price has stretched away from an adaptive mean — and whether it's starting to snap back. From that logic, the tool plots two main actionable events on the oscillator panel:
- Buy Trigger: Signals that downside exhaustion + early reversal behavior just activated.
- Sell Trigger: Signals that upside exhaustion + early reversal behavior just activated.
These triggers are meant to highlight "this is where exhaustion may be unwinding." This is not a guarantee to long/short immediately. Instead:
- Treat a Buy Trigger as "bullish reversal conditions just fired."
- Treat a Sell Trigger as "bearish reversal conditions just fired."
You still manage entry method, stop, confirmation, higher timeframe bias, etc.
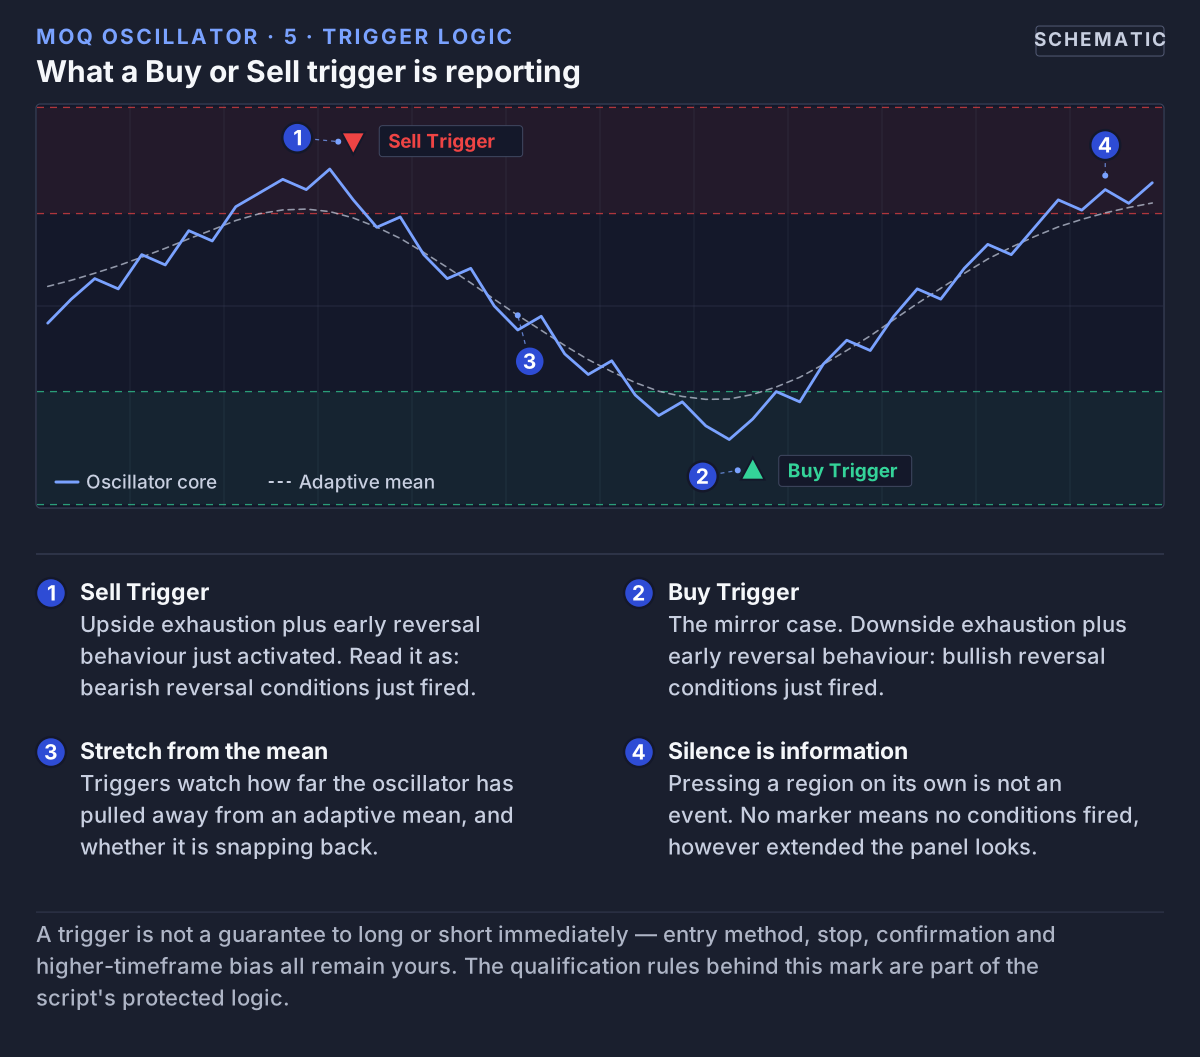 A trigger reports that reversal conditions just fired. Where nothing fires, the panel stays silent — however stretched it looks.
6. Early Warnings (Pre-Signals & Wait Signals)
Instead of just shouting "buy now," MoQ Osci breaks the setup into phases.
Pre-Signals
These are early warnings that conditions are approaching stress:
- "Pre-Buy" tells you we're nearing potential bullish exhaustion (oversold-type pressure).
- "Pre-Sell" tells you we're nearing potential bearish exhaustion (overbought-type pressure).
These show up as visual markers on the oscillator, before any trigger fires. They're basically: "Wake up. Something interesting may be forming."
Wait Signals
Sometimes you get stress, but it's too early to act. In that case, MoQ Osci can show "wait"-style markers. Meaning:
- "Yes, there is pressure here."
- "No, it's not clean yet."
- "Do not rush."
Bearish example:
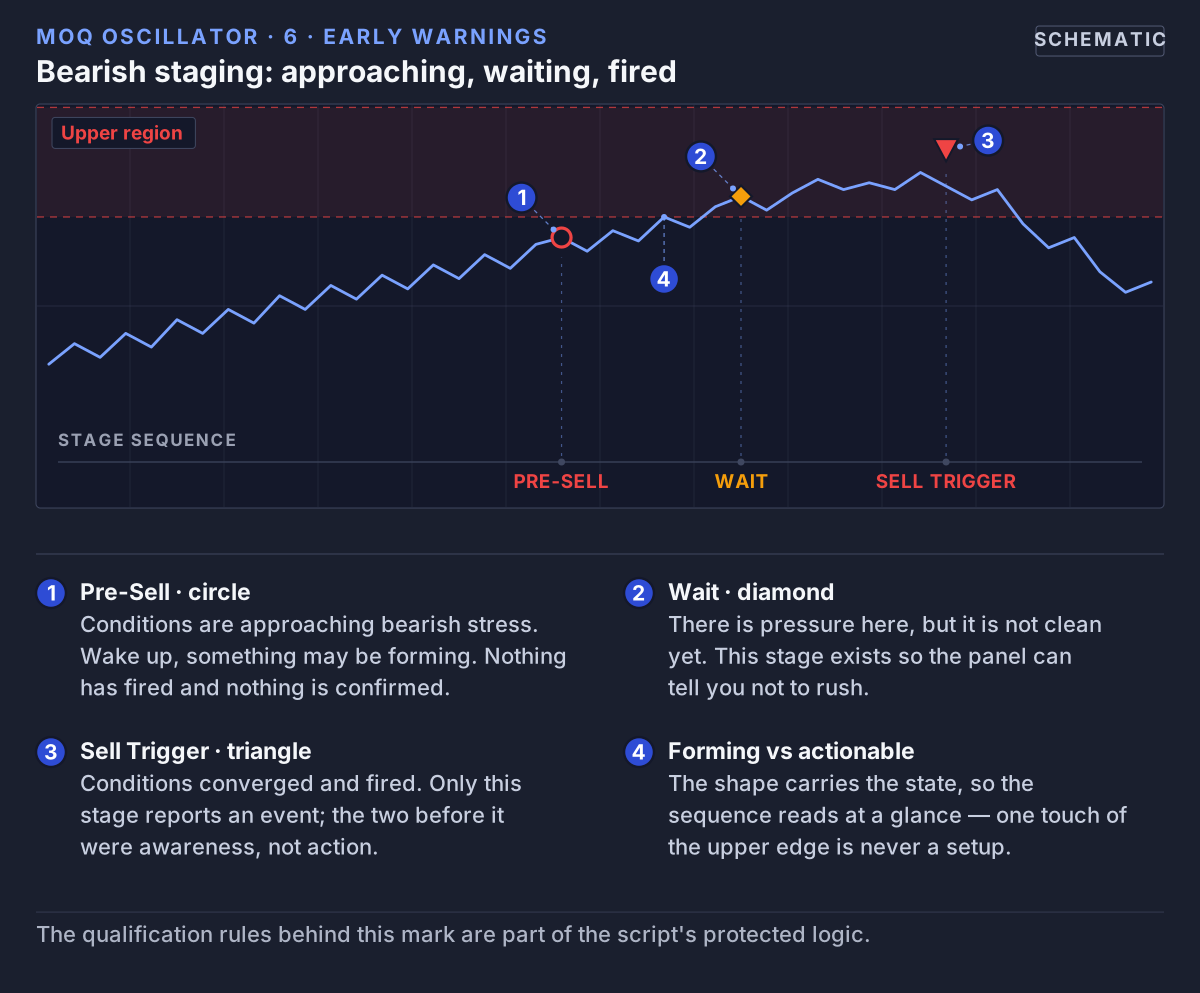 The bearish sequence in order: approaching stress, pressure that is not clean yet, and only then a fired condition.
Bullish example:
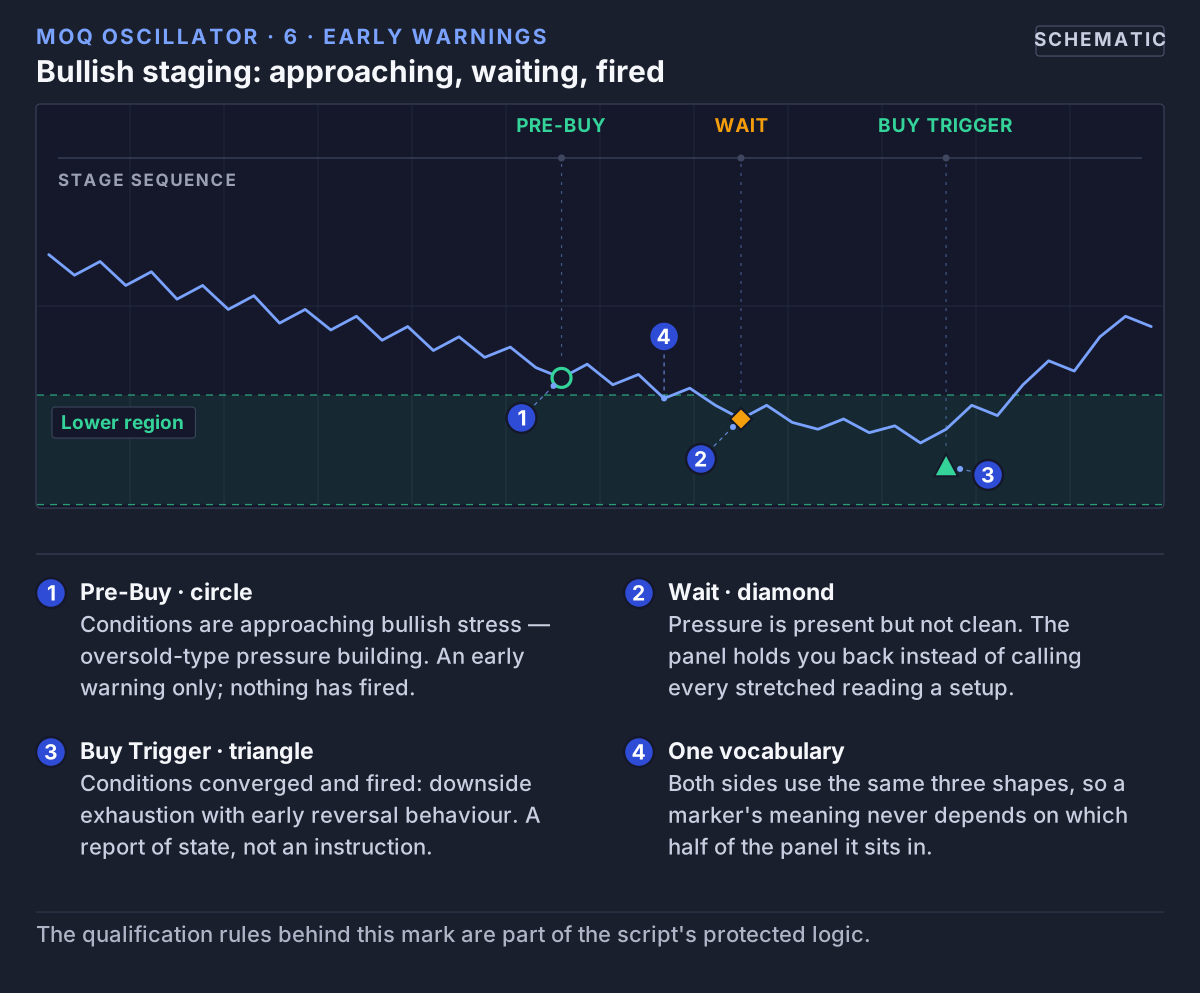 The same three stages mirrored: the bullish sequence runs circle, diamond, triangle in exactly the same order.
This separation between "forming" and "actionable" helps you avoid jumping into every touch of a band.
Mean/Equilibrium Cross (Optional)
You can optionally show markers when momentum shifts back through its local mean.
That can be used as follow-through confirmation, especially for traders who prefer to avoid knife-catching.
7. Visual Structure
MoQ Osci is meant to be read quickly. You may see, depending on your settings:
- Histogram bars: Helps you read acceleration vs deceleration in momentum.
- Main oscillator line and signal line: Color-coded so you can quickly see bias.
- Adaptive bands: Show when momentum is pressing the edges of its normal envelope.
- Shaded zones: Subtle fills in the oscillator panel to highlight stressed regions, "normal" regions, and cooling-off periods.
- State markers: Circles, diamonds, triangles. Each shape represents a different state: approaching stress, waiting, confirmed trigger.
- Optional divergence lines: The script can attempt to mark divergence between price and oscillator. This is an advanced feature that visually connects pivot points to warn when price makes a new high (or low) but momentum fails to confirm.
All visuals are theme-aware (Light Mode / Dark Mode), so contrast stays readable and your chart doesn't become unusable. You can turn off anything you don't want to see.
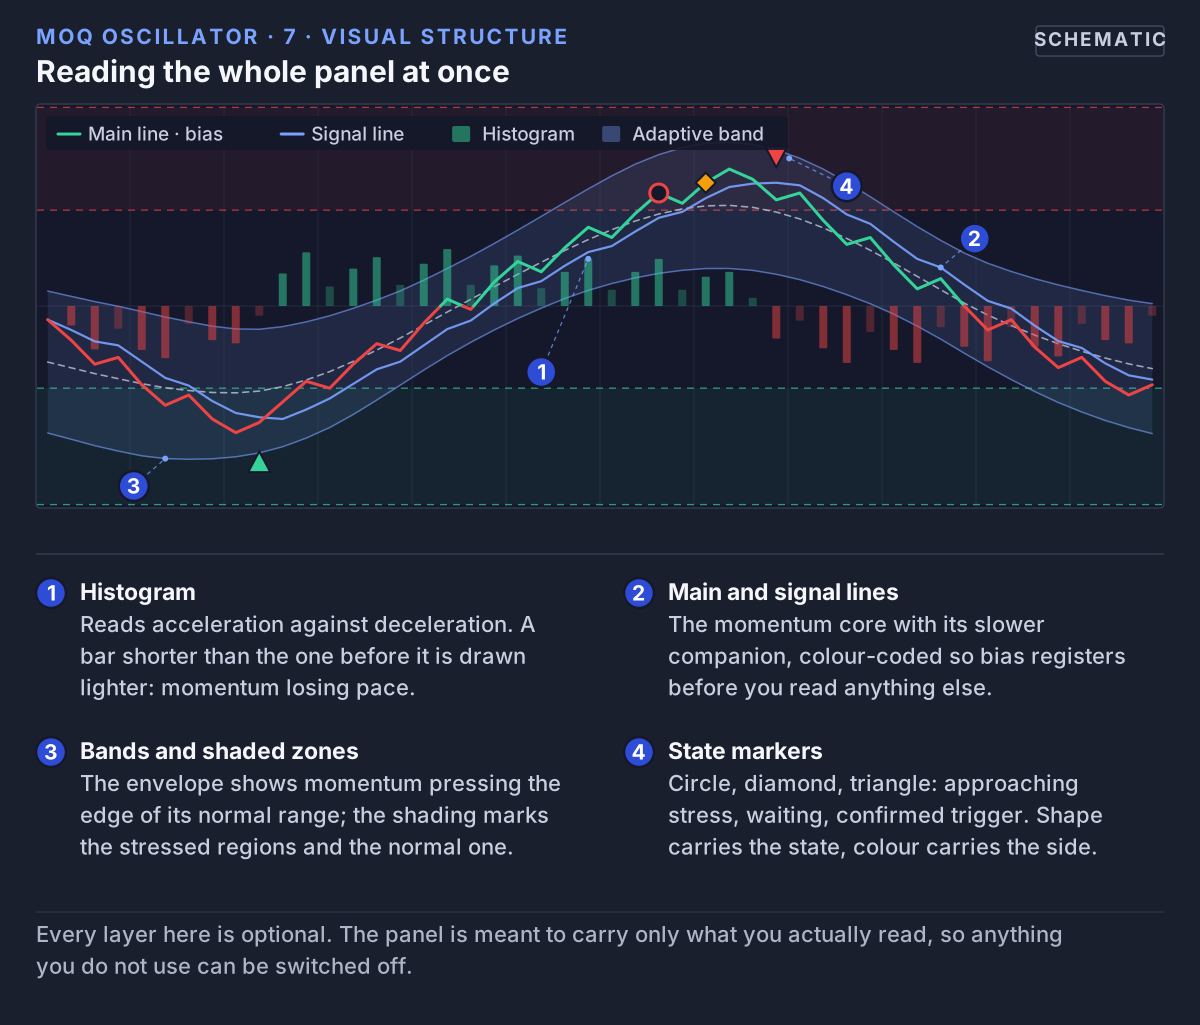 Everything the panel can draw, in one frame: histogram, main and signal lines, adaptive band, shaded regions and state markers.
8. Alerts
MoQ Osci includes four alert conditions you can hook into TradingView alerts:
- Buy Trigger: Signals conditions consistent with a potential bullish reversal / upside bias.
- Sell Trigger: Signals conditions consistent with a potential bearish reversal / downside bias.
- Pre-Buy (awareness): Early bullish stress building. Good for "watch this soon."
- Pre-Sell (awareness): Early bearish stress building. Good for "watch this soon."
How you use them:
- Add MoQ Osci to your chart.
- Create an alert in TradingView and select one of these conditions.
- Choose your preferred alert frequency (for example, only on bar close if you want fewer false starts).
These alerts are there to get your attention, not to auto-trade for you.
9. How Traders Commonly Use MoQ Osci
Here are typical use cases. These are examples, not instructions.
A. Reversal Watching
- You see early "pre-buy" style conditions forming.
- Later, an official "buy trigger" fires.
- You check higher timeframe bias and key market structure.
- You consider a long, with risk controls.
Same idea flipped for shorts.
B. Exhaustion / Fade
- The oscillator is pressing its dynamic upper zone.
- You get a warning that upside pressure may be peaking.
- You watch for a shift in structure or confirmation before fading strength.
- You do not assume "overbought = must short." You treat it as information.
C. Continuation Read
- You get repeated downside exhaustion signals, but price keeps grinding down.
- That tells you: the market is in a heavy trend and keeps ignoring bounce conditions.
- Instead of blindly countertrending, you recognize: "momentum is still in control."
D. Regime Context
- The oscillator spends most of its time above its mid-zone and keeps firing bearish fade attempts that fail.
- That's often a sign of persistent bullish regime.
- You lean long-biased until that regime meaningfully changes.
10. Customization & Performance
MoQ Osci is intentionally modular. You can:
- Switch between visual themes (Light / Dark).
- Pick which band style you want (classic-style vs adaptive kernel-style).
- Show or hide shaded zones and bands.
- Show or hide pre-signal / wait / mean markers.
- Show or hide divergence lines.
- Reduce visual load if you want a cleaner panel.
If you're running on a lower-performance device or very low timeframe charts and it ever feels heavy, you can turn off optional visuals like divergence drawing or advanced band smoothing. You are in control of how dense or minimal the panel looks.
11. Access
MoQ Osci may be provided as an invite / restricted-access script. If access is restricted:
- Visit the MomentumQ profile on TradingView.
- Use the "Message" option.
- Include your TradingView username and how you plan to use the tool.
Please only rely on scripts from authors you trust and fully understand. You can always explore public, open-source indicators for comparison and learning.
12. Legal Disclaimer
MoQ Osci and this documentation are provided for educational and informational purposes only. They:
- Do not constitute financial, investment, trading, or risk management advice.
- Do not guarantee performance, profitability, or specific outcomes.
Trading and investing involve risk, including the possible loss of capital. Past performance is not indicative of future results.
You are solely responsible for any decisions you make in the market. You should consider consulting a licensed financial professional before acting on any information derived from this tool.
MoQ Osci is proprietary to MomentumQ GmbH and provided for personal, non-transferable use under the MomentumQ Terms of Service; any redistribution, modification, or source extraction is prohibited.
© MomentumQ GmbH. All rights reserved.