Pine Script v6 · License: proprietary — MomentumQ GmbH · © MomentumQ GmbH
1. Overview
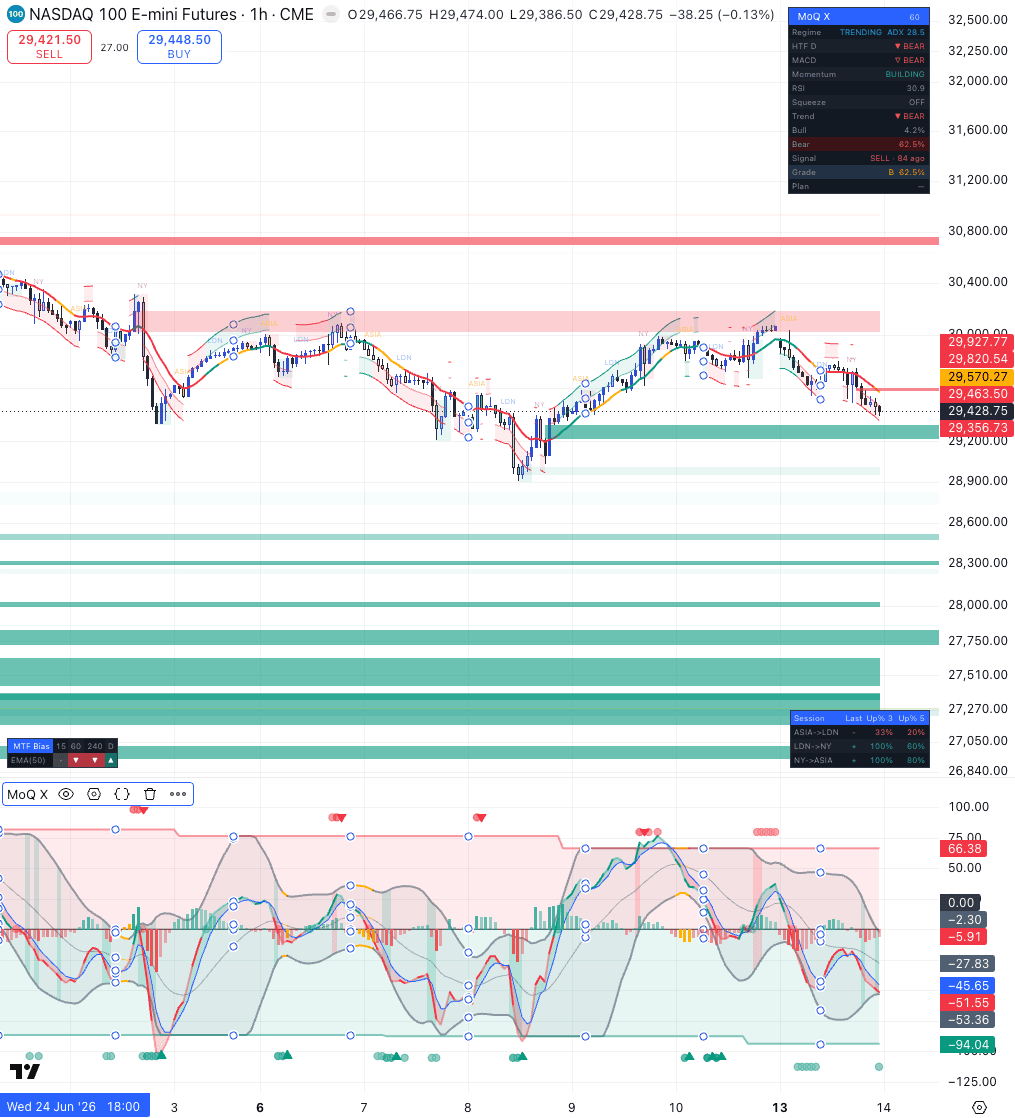
MoQ X is a regime-adaptive multi-factor confluence framework. It combines a normalized MACD oscillator, Nadaraya-Watson trend envelopes, structural zones (supply/demand, order blocks, fair value gaps), a higher-timeframe bias gate, a VIX risk-on/risk-off overlay, and session markers into a single weighted scoring engine. The defining characteristic is that the scoring weights shift automatically based on whether ADX classifies the market as trending or ranging.
The script occupies its own pane and additionally plots analysis on the price chart. There are no buy/sell labels rendered on the chart — confluence signals surface only via the dashboard's "Signal" row and through alert conditions.
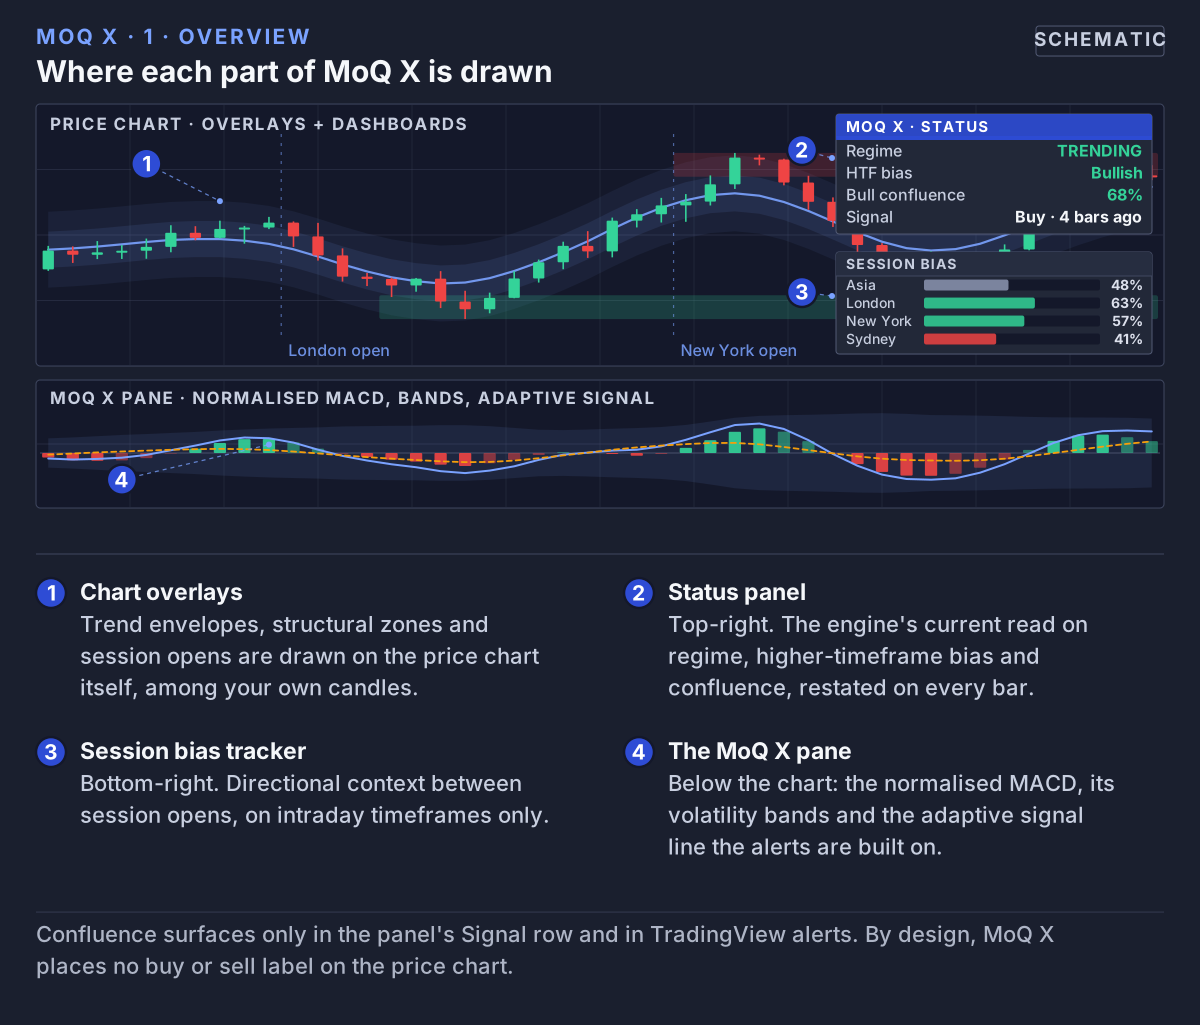 MoQ X draws in two places at once: its own oscillator pane, and overlays plus two dashboards on the price chart itself.
2. Modules
- Master Control — toggles for overlay features, confluence engine, and dashboards
- Regime Detection — ADX-based classifier (trending / ranging / transition)
- Multi-Timeframe Bias — auto or manual HTF EMA + slope confirmation
- MACD Core — adaptive-scaled MACD
- MACD Bands & Squeeze — volatility envelope with squeeze detection
- Adaptive Signals — adaptive smoothing line with envelope triggers
- MACD Dynamic Levels — oscillator-pivot smoothed S/R
- MACD Divergence — regular and hidden divergence detection
- Overlay Trend Envelopes — Nadaraya-Watson with four kernel modes
- Supply & Demand Zones — clustered pivot-based zones
- Order Blocks — swing-structure detection with optional wick shadows
- Fair Value Gaps — three-bar pattern with partial-fill shrinking
- Price Gaps — strict mode option, partial-fill tracking
- Sessions — Asia, London, New York, Sydney with bar coloring and labels
- VIX Risk-On / Risk-Off — three-tier signal system with correlation gating
- Confluence Engine — nine-factor weighted scoring with regime-adaptive weights
- ATR Trail — optional trailing stop after confluence signals
- Dashboard — live status panel + session directional bias tracker
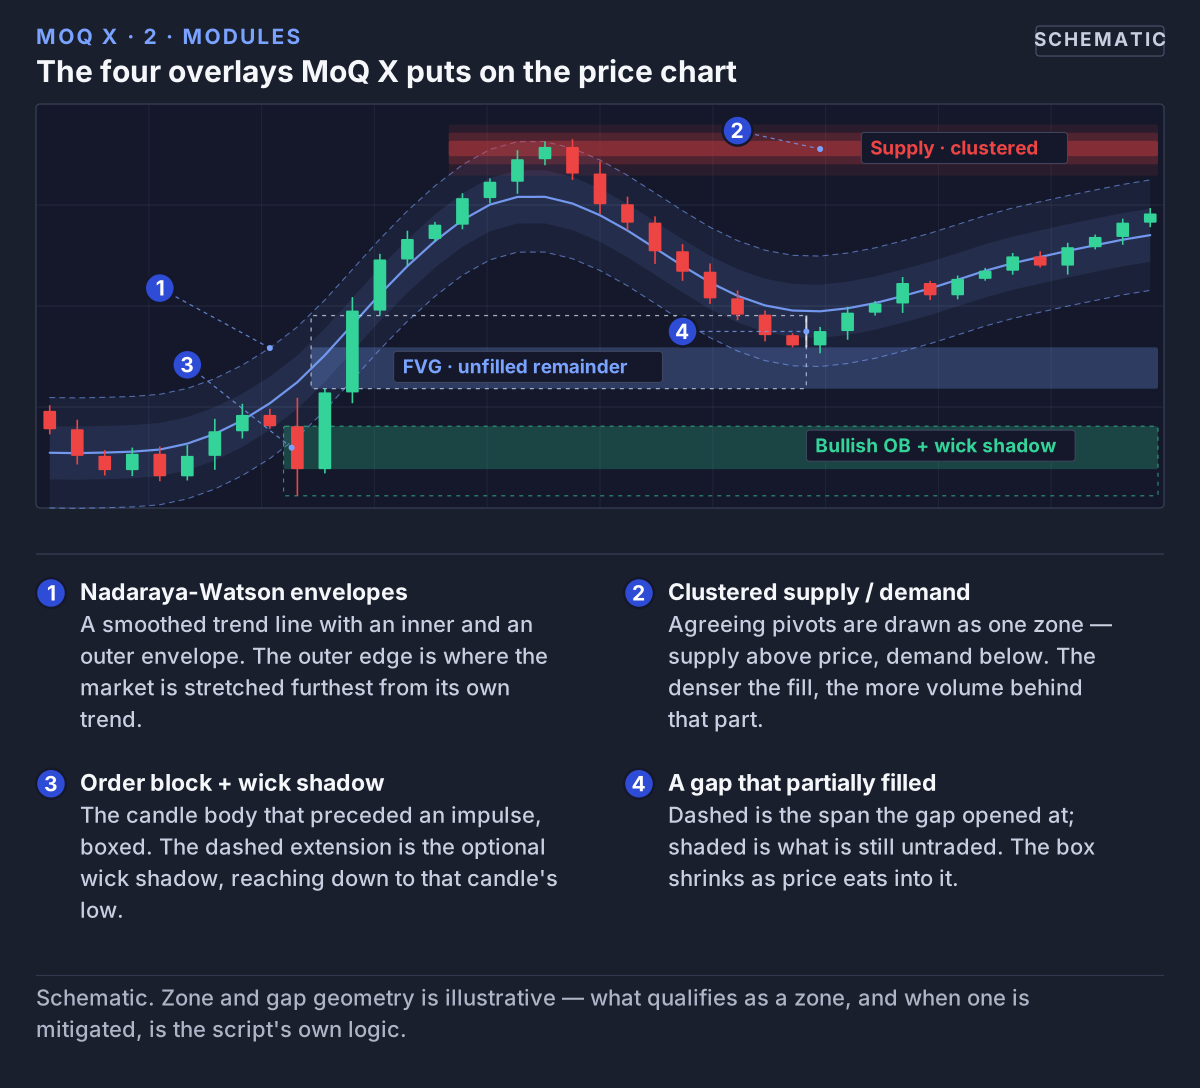 The overlay layer on one chart: envelopes, a clustered zone, an order block, and a gap that has shrunk to the part of it price has not yet traded back through.
3. Regime Detection
ADX is computed in real time and classifies the market into one of three states: trending, ranging, or transition. The confluence engine re-weights its factors to match the detected state; the specific weighting scheme is proprietary and not documented.
4. Confluence Engine
Nine inputs feed a weighted score in each direction:
- MACD state
- RSI profile
- Stochastic extremes
- Nadaraya-Watson trend direction
- Zone touches
- Squeeze releases
- Higher-timeframe alignment
- Momentum acceleration
- Divergence
A confluence signal is registered when four conditions are simultaneously true:
- The weighted score crosses a user-configurable threshold
- At least one trigger is active
- The cooldown period has elapsed
- The optional higher-timeframe alignment gate permits the direction
Exit conditions are registered on counter-confluence or on momentum fade with a confirming MACD cross.
5. Dashboards
Status Panel (top-right)
Shows live values for: Regime, HTF bias, MACD state, Momentum, RSI, Squeeze status, Trend direction, Bull confluence %, Bear confluence %, and last Signal (with bars-ago counter).
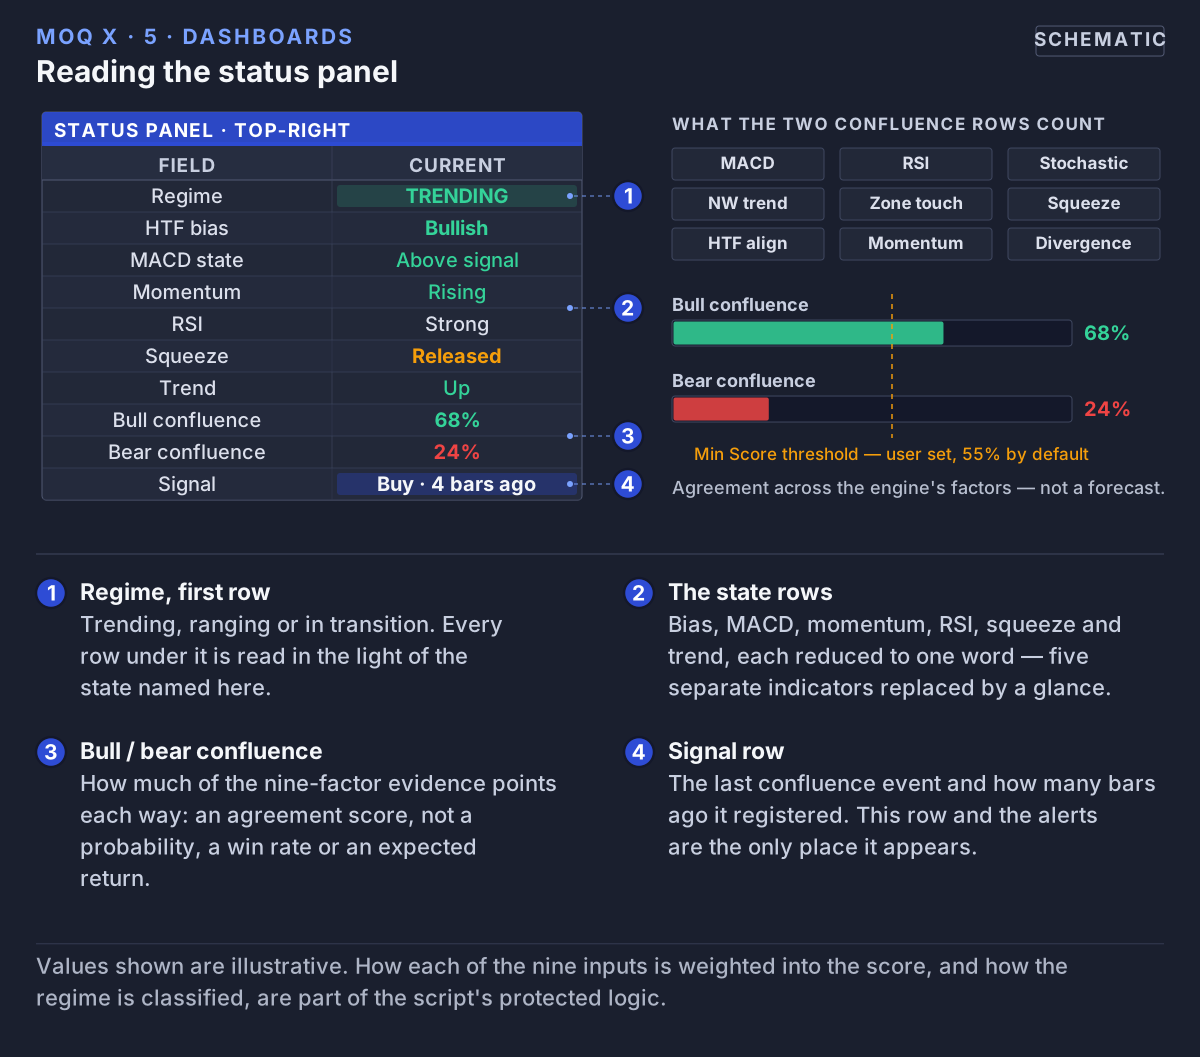 The status panel reduces the whole engine to ten rows — including the Signal row, which is the only place a confluence call is shown.
Session Directional Bias Tracker (bottom-right)
Displays the up-close rate between consecutive session opens over recent windows. This measures price direction between session boundaries — it is not a measure of trade performance.
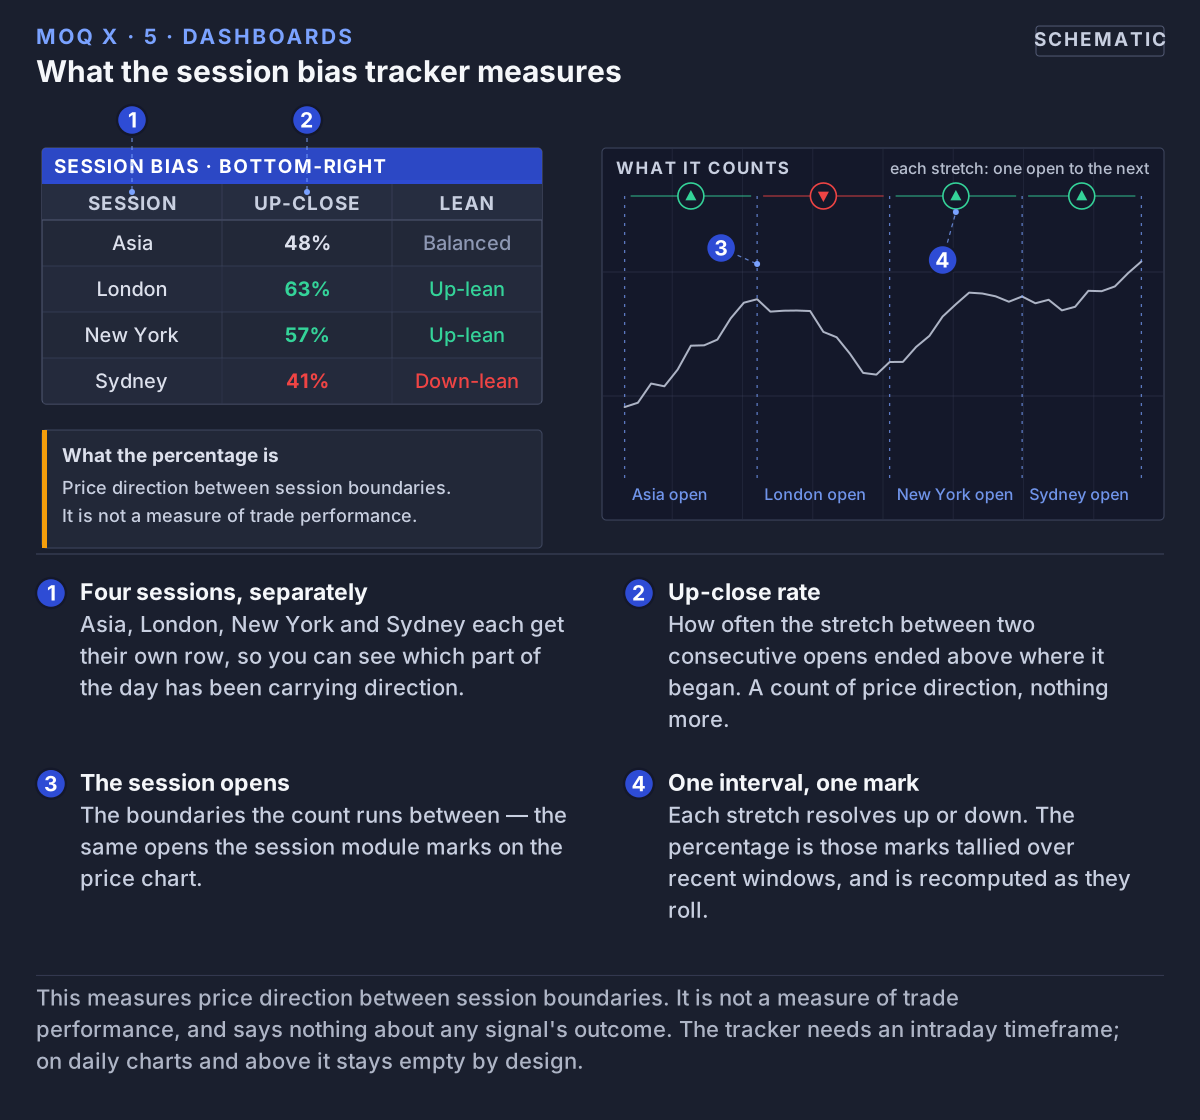 The tracker counts how often the stretch between one session open and the next closed higher — price direction between boundaries, nothing about trades.
6. Alert Conditions
Ten alert conditions are exposed and can be configured from the TradingView alert panel. All messages prefix with "MoQ X:".
- Confluence BUY / SELL — full alignment of score, trigger, cooldown, and HTF gate
- Exit Long / Exit Short — counter-confluence or momentum fade with confirming MACD cross
- Adaptive Buy / Adaptive Sell — adaptive distance crosses lower/upper envelope
- Squeeze Start / Squeeze Release — bandwidth compression begins / ends
- MACD Cross Up / Down — MACD line crosses signal line
7. Settings
Each module has its own input group with tooltips on every setting. Key controls include:
- Min Score (%) — confluence score threshold for signal registration. Default 55. Higher = fewer, higher-agreement signals.
- Signal Cooldown — minimum bars between consecutive signals.
- Require HTF Alignment — gates entries by higher-timeframe direction.
- VIX Correlation Mode — Auto, Positive, or Negative. Set to Positive or Auto for non-equity instruments.
- Master Control — independently toggle overlay features, confluence engine, and dashboards.
8. Recommended Workflow
- Add MoQ X to your chart. It works on any timeframe and instrument.
- Read the status panel for current regime, HTF bias, momentum, squeeze, and confluence percentages.
- Wait for confluence signals — these only fire when the engine agrees across factors.
- Use the bottom-right session tracker for context on intraday price direction.
- Configure alerts for the conditions you care about and let them notify you instead of watching the chart.
9. Notes & Limitations
- The session tracker requires intraday timeframes (under 4 hours). On daily and above, the tracker stays empty by design.
- The VIX overlay assumes
TVC:VIX is accessible in your data permissions. If unavailable, VIX-related state silently falls back to na and the overlay does not render.
- The dashboard "Signal" row tracks the most recent buy/sell with a bars-ago counter. There is no corresponding chart label by design.
10. Access
MoQ X is published as an invite-only script on TradingView. Access is granted on an invite-only basis through your MomentumQ subscription.
11. Disclaimer
This indicator provides contextual analytical inputs and is not a complete trading system. It does not generate trade recommendations, guarantee any outcome, or infer future performance from past behavior. Dashboard readings and alerts should be treated as one input among many alongside risk management, position sizing, and your own judgment. No claim is made about accuracy, reliability, or profitability on any specific instrument or timeframe.
All trading involves risk. You are solely responsible for your investment decisions and should consult a licensed financial advisor before acting on any analysis.
The MoQ X script and all related materials are proprietary to MomentumQ GmbH and provided for personal, non-transferable use under the MomentumQ Terms of Service; redistribution, modification, and source extraction are prohibited.
© MomentumQ GmbH. All rights reserved.