Version: V2.0 · License: proprietary — MomentumQ GmbH · © MomentumQ GmbH
1. What MomentumQ Dash Does
MomentumQ Dash is built to answer three questions instantly:
- "What is the current directional bias (Bull or Bear)?"
- "Is there an actionable setup forming right now, or did it already fire?"
- "Is risk sentiment supportive or hostile across correlated markets?"
Instead of flipping charts — lower → higher TF, SPX → VIX → oil → BTC — you get that entire situational picture in two clean tables on your current chart. You see:
- Regime (Bull / Bear)
- Confirmed Buy / Sell triggers
- Pre-Buy / Pre-Sell warnings (early setups forming)
- 'Upper Limit' / 'Lower Limit' pressure zones
- How many candles ago the most recent event occurred
This gives you bias alignment and timing context at a glance.
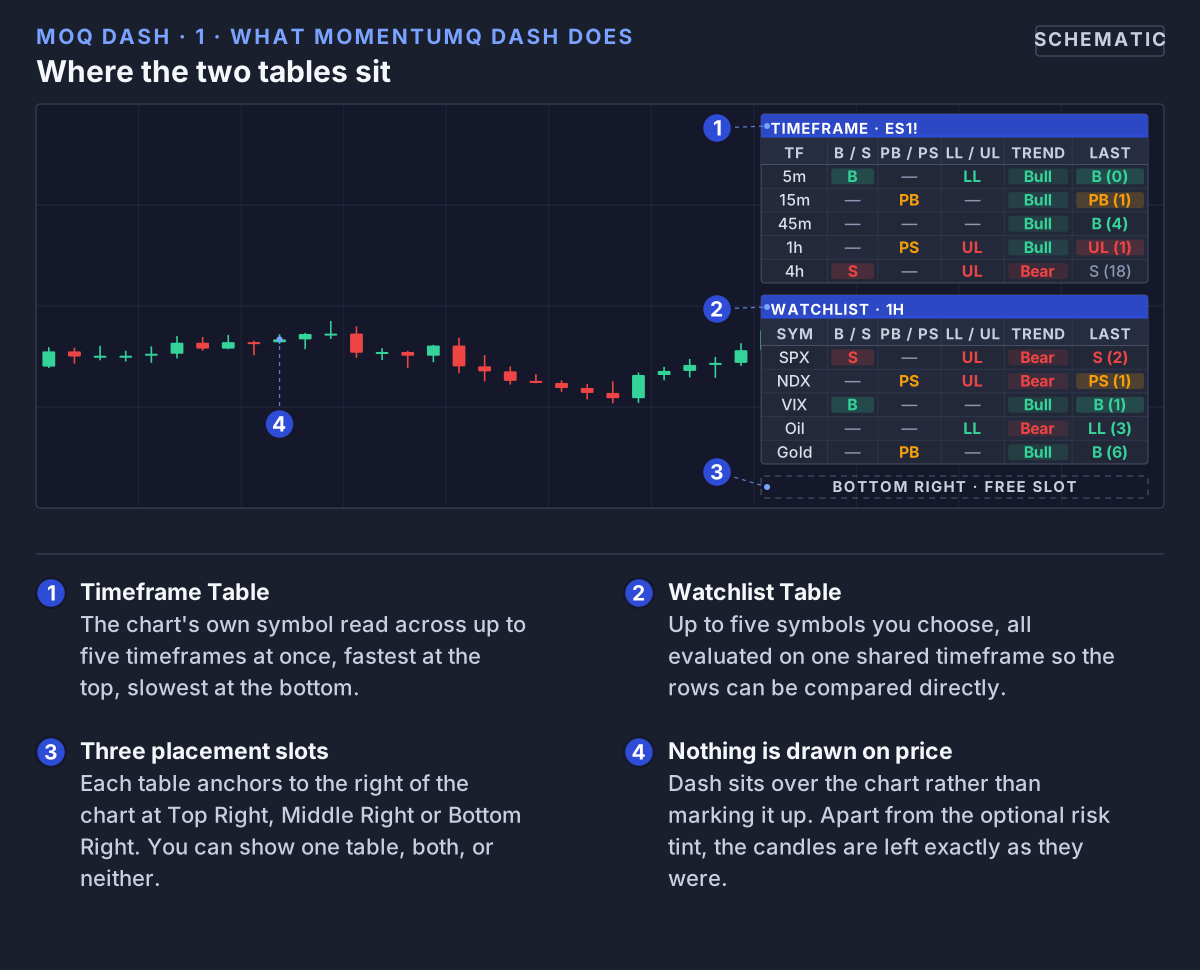 Both tables sit against the right edge of the chart, in any of three placement slots, and leave the candles untouched.
2. The Timeframe Table (Multi-Timeframe View)
The Timeframe Table analyzes the current chart symbol (for example, BTCUSD or ES1!) across up to five user-selected timeframes (e.g. 5m, 15m, 45m, 1h, 4h). For each timeframe, the table shows:
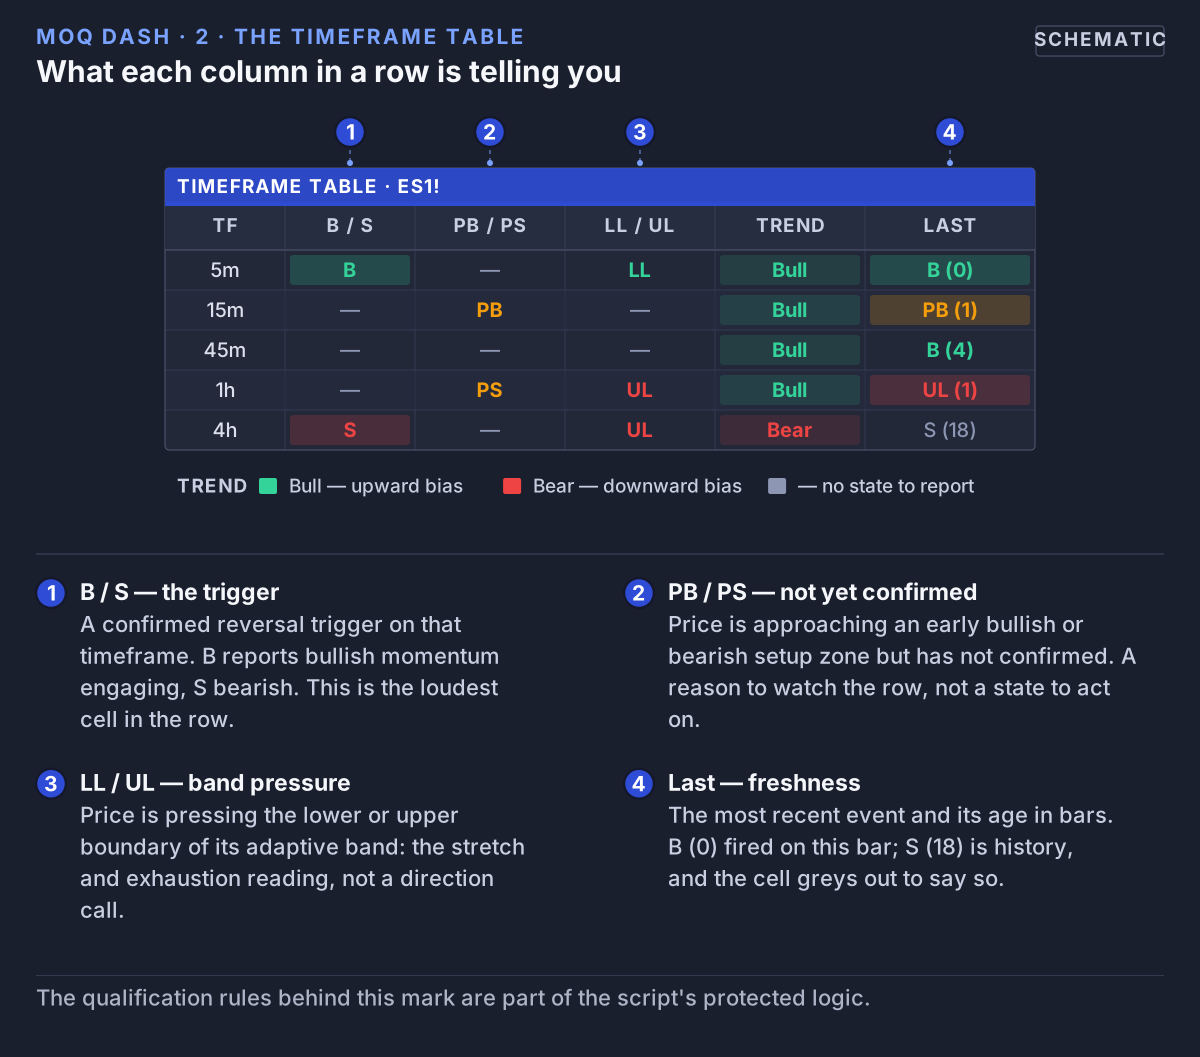 One symbol, five timeframes: a confirmed trigger, an early state, band pressure, the regime, and how many bars ago it last happened.
B (Buy)
A bullish reversal trigger. The oscillator is signaling that downside pressure may have exhausted and bullish momentum is engaging.
S (Sell)
A bearish reversal trigger. The oscillator is signaling that upside pressure may have exhausted and bearish momentum is engaging.
PB / PS (Pre-Buy / Pre-Sell)
Early warning states:
- PB (Pre-Buy): Price is approaching an early bullish setup zone, but hasn't fully confirmed yet.
- PS (Pre-Sell): Price is approaching an early bearish setup zone, but hasn't fully confirmed yet.
Pre-Buy / Pre-Sell conditions help you watch for potential turns before they're obvious.
LL / UL (Lower Limit / Upper Limit)
- LL = price is pressing the lower boundary of its adaptive band.
- UL = price is pressing the upper boundary of its adaptive band.
These zones often align with exhaustion, stalling, or potential fade points.
Trend (Bull / Bear)
The directional regime for that timeframe. Bull means upward bias / positive momentum pressure. Bear means downward bias / negative momentum pressure. This is derived from how price sits relative to its adaptive mean and band structure.
Last
Shows the most recent event (for example, PB (2) or B (0)), along with how many bars ago it occurred.
- B (0) means a Buy trigger just fired on the current bar.
- S (5) means a Sell trigger happened 5 bars ago.
- UL (1) means we touched the upper limit 1 bar ago.
This gives you timing context. You immediately know if you're late, early, or right on time.
Why this table matters
This table lets you align lower timeframe entry conditions with higher timeframe bias.
Example:
- 15m and 1h both in Bear regime and showing PS / S → avoid longs.
- 5m flashing PB while 1h and 4h are Bull → possible long scalp in direction of higher timeframe trend.
3. The Watchlist Table (Multi-Asset View)
The Watchlist Table lets you track up to five custom symbols on a single chosen timeframe. For example: SPX, NDX, VIX, Oil, Gold.
You choose which symbols to track and which timeframe to evaluate them on (e.g. 1h). For each symbol in the watchlist, the table shows the same columns as in the Timeframe Table: B / S, PB / PS / LL / UL, Trend (Bull / Bear), and Last (latest event + bars ago).
Symbols are automatically cleaned for display (exchange prefixes like BINANCE: or NYSE: are removed where possible for a shorter label).
Why this table matters
This gives you instant correlation context and macro feel:
- Are equity indices firing Sell while VIX is in risk-on or risk-off mode?
- Is Oil flipping Bear while Gold is showing Buy?
- Are crypto majors aligned or diverging?
You don't need to open five charts. You read one panel.
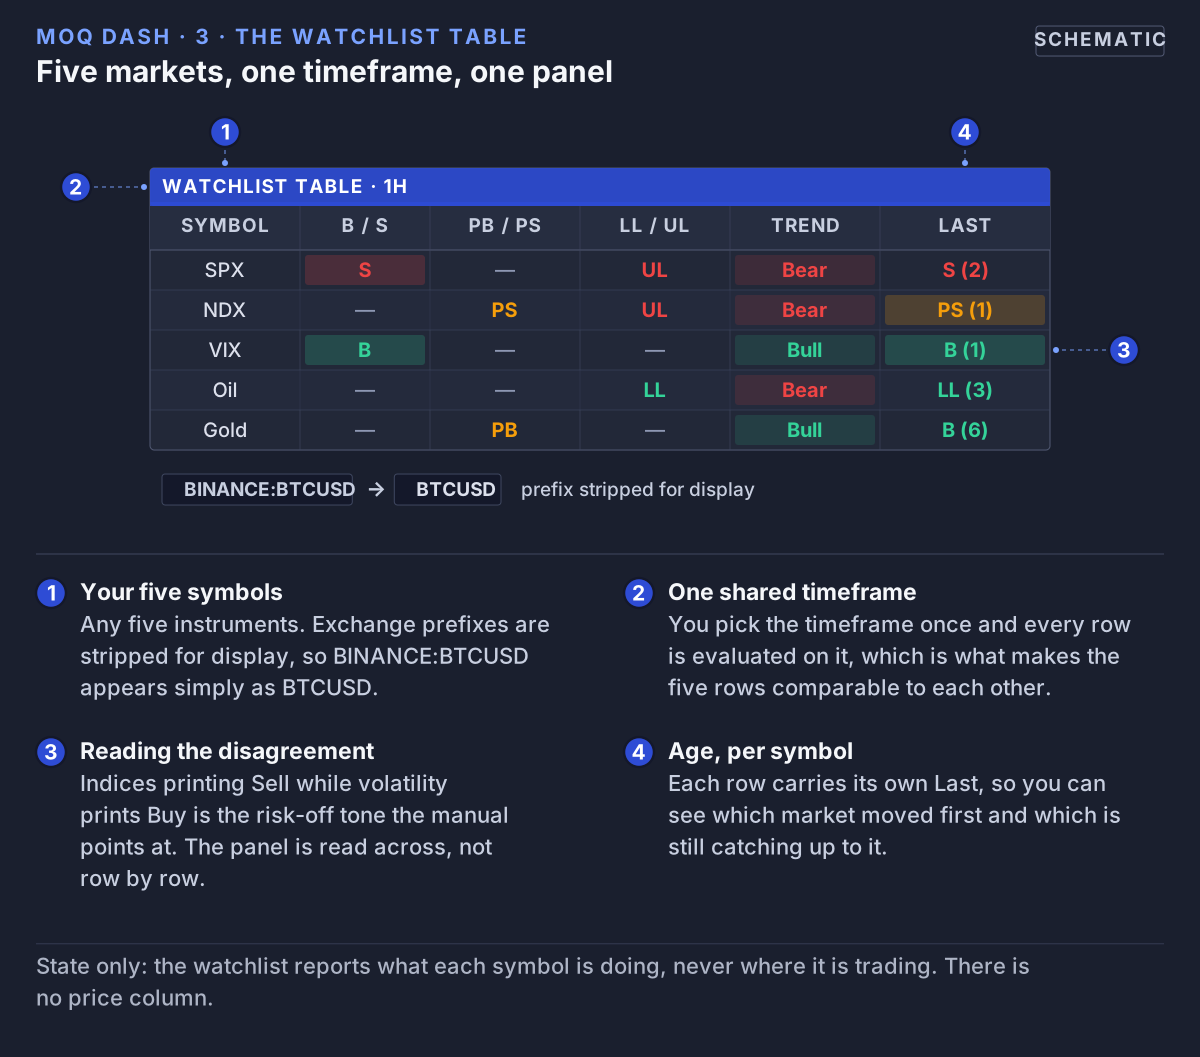 Five instruments on one shared timeframe. Equity indices leaning one way while volatility leans the other is the correlation context this table is for.
4. Signal Logic (Powered by MoQ Osci)
All table values are derived from the MomentumQ Oscillator (MoQ Osci), MomentumQ's proprietary engine that measures momentum relative to an adaptive mean and adaptive bands.
The core states:
- B (Buy): Bullish reversal trigger. Often appears when price pushes into lower pressure and then turns up.
- S (Sell): Bearish reversal trigger. Often appears when price pushes into upper pressure and then turns down.
- PB (Pre-Buy): "We are entering bullish pressure, but not fully confirmed yet." Can mark early accumulation before reversal.
- PS (Pre-Sell): Mirror of PB on the bearish side: "We are starting to lean bearish but it hasn't fully broken yet."
- LL (Lower Limit): Price is pressing the lower envelope / lower band area. Often means extreme downside stretch / possible support test.
- UL (Upper Limit): Price is pressing the upper envelope / upper band area. Often means extreme upside stretch / potential exhaustion.
- Trend (Bull / Bear): A simplified directional regime based on where current momentum sits relative to its adaptive mean and band midline.
- Last: The freshest event, with age in bars. This prevents you from reacting to something that happened 18 candles ago and is already stale.
Why this matters
You are not just getting "buy / sell" alerts. You're getting:
- Directional bias (Trend)
- Maturity (Last + bars ago)
- Pre-conditions (PB / PS)
- Pressure zones (LL / UL)
This is information, not just noise.
5. Risk Regime Overlays (Optional Module)
MomentumQ Dash can optionally overlay a background color on your chart to show Risk ON / Risk OFF conditions, using a macro driver such as VIX or any symbol you choose (for example DXY).
How it works
The same MoQ Osci logic is applied to the driver (VIX, DXY, etc.). The script classifies the environment into high-priority states:
- Strong (highest conviction)
- Pre (early warning)
- Flip (possible turn forming)
The background is tinted green-ish for risk-on or red-ish for risk-off.
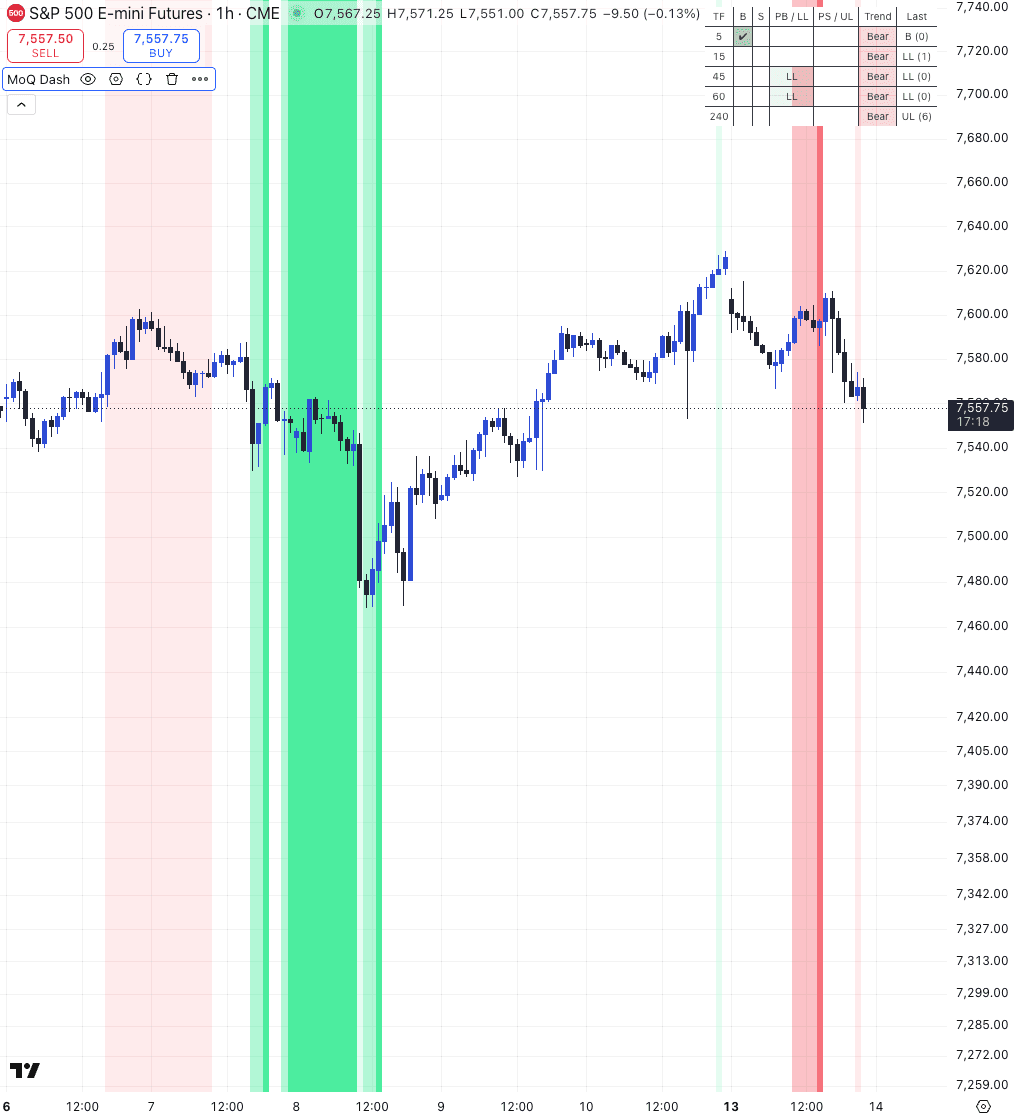
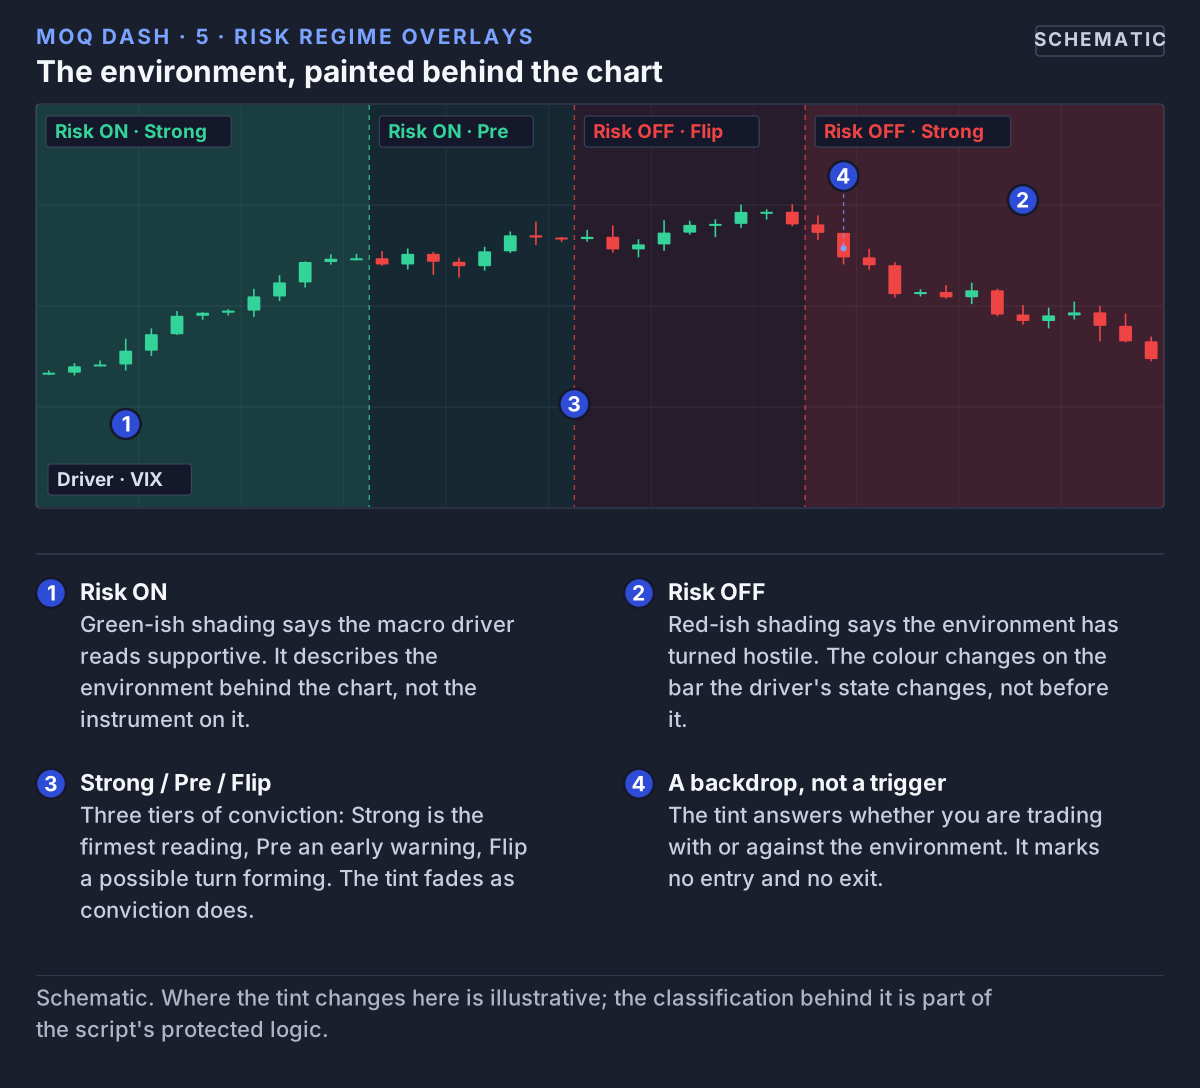 The optional overlay tints the chart behind the candles: green-ish while the driver reads risk-on, red-ish once it turns.
Correlation Awareness
You can define whether the driver is normally positively or negatively correlated to your chart, or let the indicator auto-detect correlation. The color can auto-invert so the regime makes sense for the instrument you are actually trading.
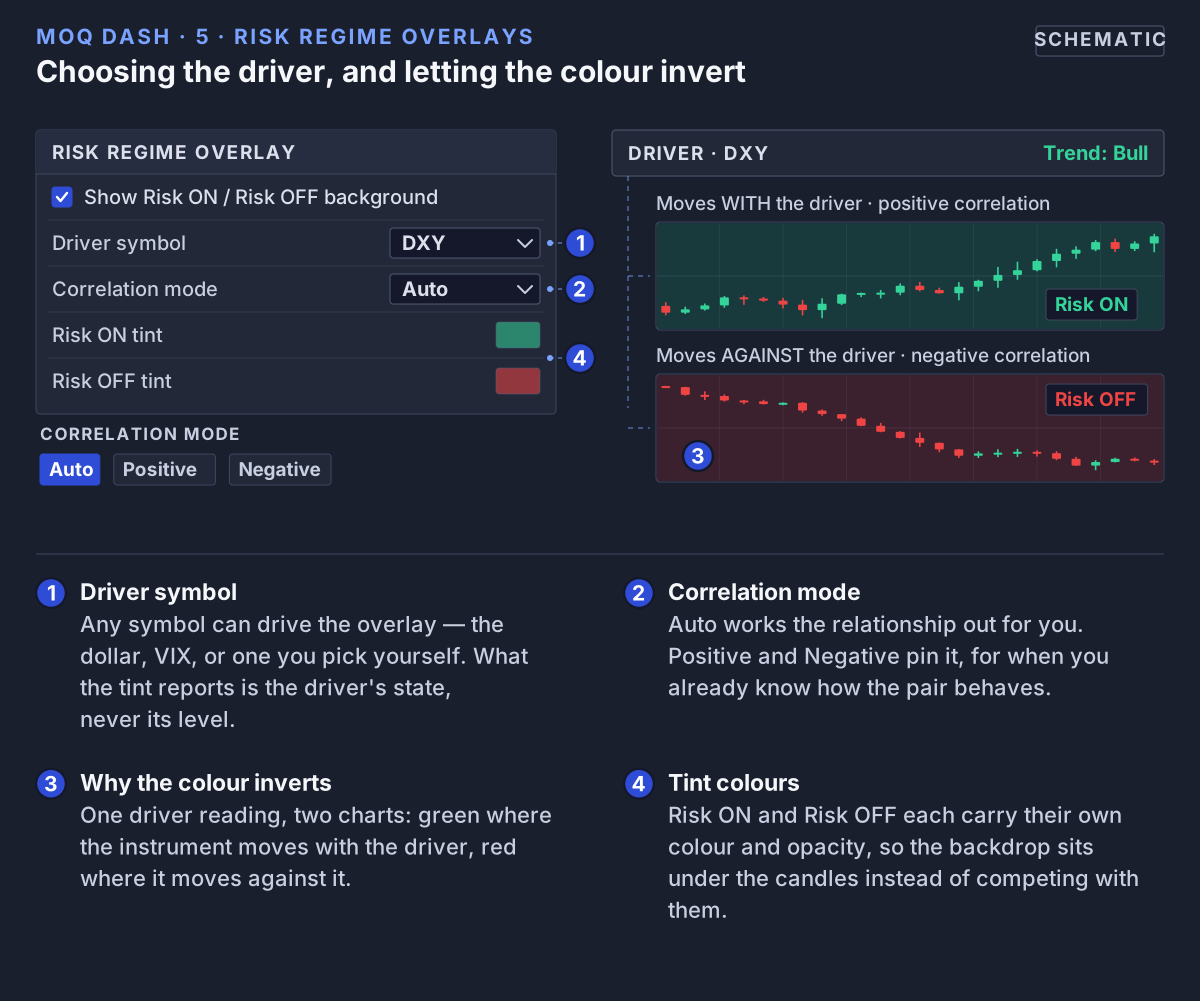 The driver's state is one thing; what it means for your chart is another. Correlation mode is what flips the colour so the backdrop reads correctly.
Why this matters
Instead of guessing "Is the environment risk-on or risk-off right now?", you get a live contextual backdrop on your own chart. This is especially useful for equities, crypto, and macro pairs.
6. Layout, Theme, and Customization
Table Placement
You can position each table (Timeframe Table and Watchlist Table) anywhere on the right side of the chart: Top Right, Middle Right, or Bottom Right. You can also show one table, both tables, or neither.
Theme
MomentumQ Dash supports Light Mode and Dark Mode. The theme setting controls text color, background color of table headers, and contrast of Bull/Bear regime cells. This keeps tables readable no matter what chart style you use.
Symbol & Timeframe Configuration
- Timeframe Table → you choose up to 5 timeframes for the current symbol.
- Watchlist Table → you choose up to 5 symbols, and you choose one timeframe that applies to all of them.
This makes the dashboard fit both scalpers and swing traders:
- Scalper: 1m / 5m / 15m / 1h / 4h bias + SPX/NDX/VIX watchlist
- Swing: 1h / 4h / 1D / 1W + commodities, dollar, indices
7. How to Use MomentumQ Dash in Practice
Intraday trading
Use the Timeframe Table to confirm that your entry timeframe is aligned with at least one higher timeframe in the same direction.
Example: You want a long. 15m shows PB or B and Trend=Bull, and 1h Trend is also Bull.
Check the Watchlist Table to confirm broader risk tone. If indices are showing Sell and VIX is in risk-off, maybe don't force a long.
Swing or macro bias
Focus on higher timeframes (1h, 4h, 1D) in the Timeframe Table. Enable the Risk ON/OFF background and choose a macro driver (e.g. DXY or VIX). Use that to frame: "Am I trading with or against the environment?"
Pre-Signal watching
Pay attention to PB (Pre-Buy) and PS (Pre-Sell). If PB starts stacking across multiple rows / assets, that may be the beginning of a rotation before the official Buy triggers.
"Last" timing check
Look at the "Last" column:
- If you see B (0) or PB (1), that's current / fresh.
- If you see S (14), that's old — don't treat it as new.
8. What This Indicator Is (and Is Not)
It is:
- A consolidated, multi-timeframe, multi-asset market state dashboard.
- A context layer for directional bias, stretch, exhaustion, confirmation, and timing.
- A macro/risk overlay helper (via VIX or custom driver).
It is not:
- An auto-trading system.
- A guaranteed entry/exit generator.
- A profit guarantee.
MomentumQ Dash is meant to support discretion, not replace it.
9. Access Model
MomentumQ Dash is an invite-only script. That means you can favorite it, but you need explicit permission to use it.
To request access: Go to the MomentumQ profile on TradingView, send a direct message, and include your TradingView username and a short note about how you intend to use the tool.
10. Legal Disclaimer
Important Notice: MomentumQ Dash and this documentation are provided for educational and informational purposes only. They do not provide financial advice, investment recommendations, or an offer to buy or sell any financial instrument.
Trading involves risk. Past performance is not necessarily indicative of future results. You are solely responsible for your own trading decisions. Consider consulting a licensed financial professional before acting on any analysis.
MomentumQ Dash is proprietary to MomentumQ GmbH and provided for personal, non-transferable use under the MomentumQ Terms of Service; redistribution, modification, and source extraction are prohibited. © MomentumQ GmbH. All rights reserved.