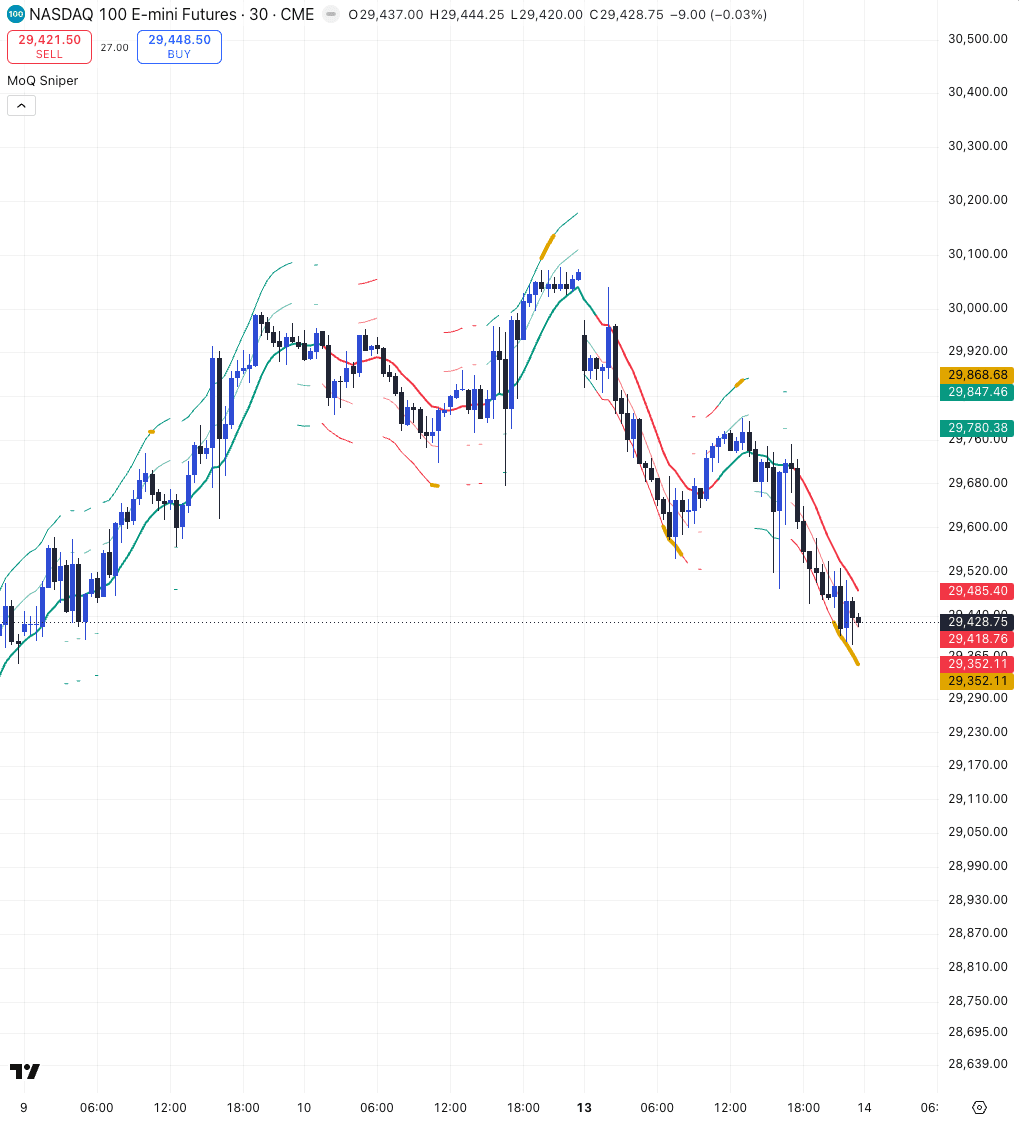
Version: V4.1 · License: proprietary — MomentumQ GmbH · © MomentumQ GmbH
1. Overview
MomentumQ Sniper integrates multiple quantitative and technical modules into one visual framework.
It's designed for professional and discretionary traders who want a complete bias and structure map directly on their chart.
Core Features
- Nadaraya-Watson Envelopes – adaptive smoothing + dynamic trend channel
- Price Countdown Setups – automatic multi-bar exhaustion detection
- Moving Average Signals – normalized distance-based turning points
- Customizable Moving Averages Stack – short- to long-term structure view
- OLS Regression Line – quick trend estimation
- Bollinger Bands Module – optional classic volatility view
- Dark / Light Mode Support
2. Theme Settings
Dark / Light Mode
Choose between Dark Mode or Light Mode to match your TradingView background.
All text, labels, and signal colors adjust automatically for clarity.
3. Moving Average Signal Engine
Function
This module measures how far price is from its Simple Moving Average (SMA) over a configurable window and normalizes that distance to identify potential momentum rotations.
Signals
- Bullish (B) – price recovering from below its mean (potential upturn)
- Bearish (S) – price retreating from above its mean (potential downturn)
These labels can be toggled with "Show MA Signals." They act as contextual momentum markers — not guaranteed entry/exit signals.
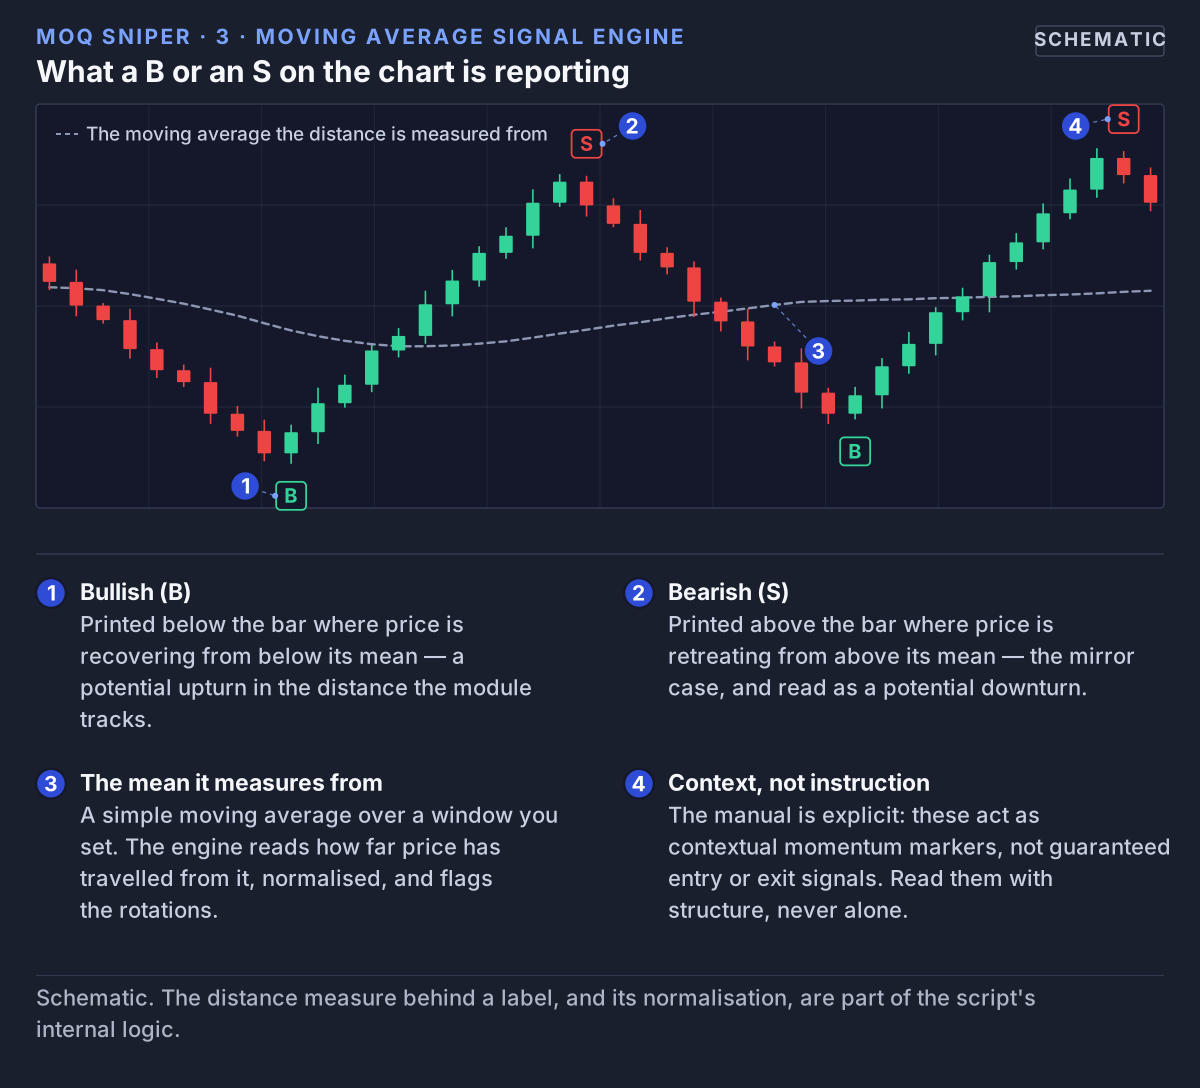 B and S mark rotations in price's distance from its moving average — contextual momentum markers, not entry or exit instructions.
4. Price Countdown Setups
Inspired by quantitative exhaustion logic, this module counts sequences of directional closes.
Conditions
- Bullish Setup: A sustained streak of weakening closes completes, suggesting downside exhaustion.
- Bearish Setup: A sustained streak of strengthening closes completes, suggesting upside exhaustion.
When the full sequence completes, the bar is highlighted. The exact counting rules and lookback references are part of the script's internal logic.
Visualization Modes
- Shapes – markers (+ or –) above/below bars
- Background – subtle background color
- Both – display both shapes and background
- Off – hide the module
Background mode:
Custom background colors (bullish / bearish) are user-defined.
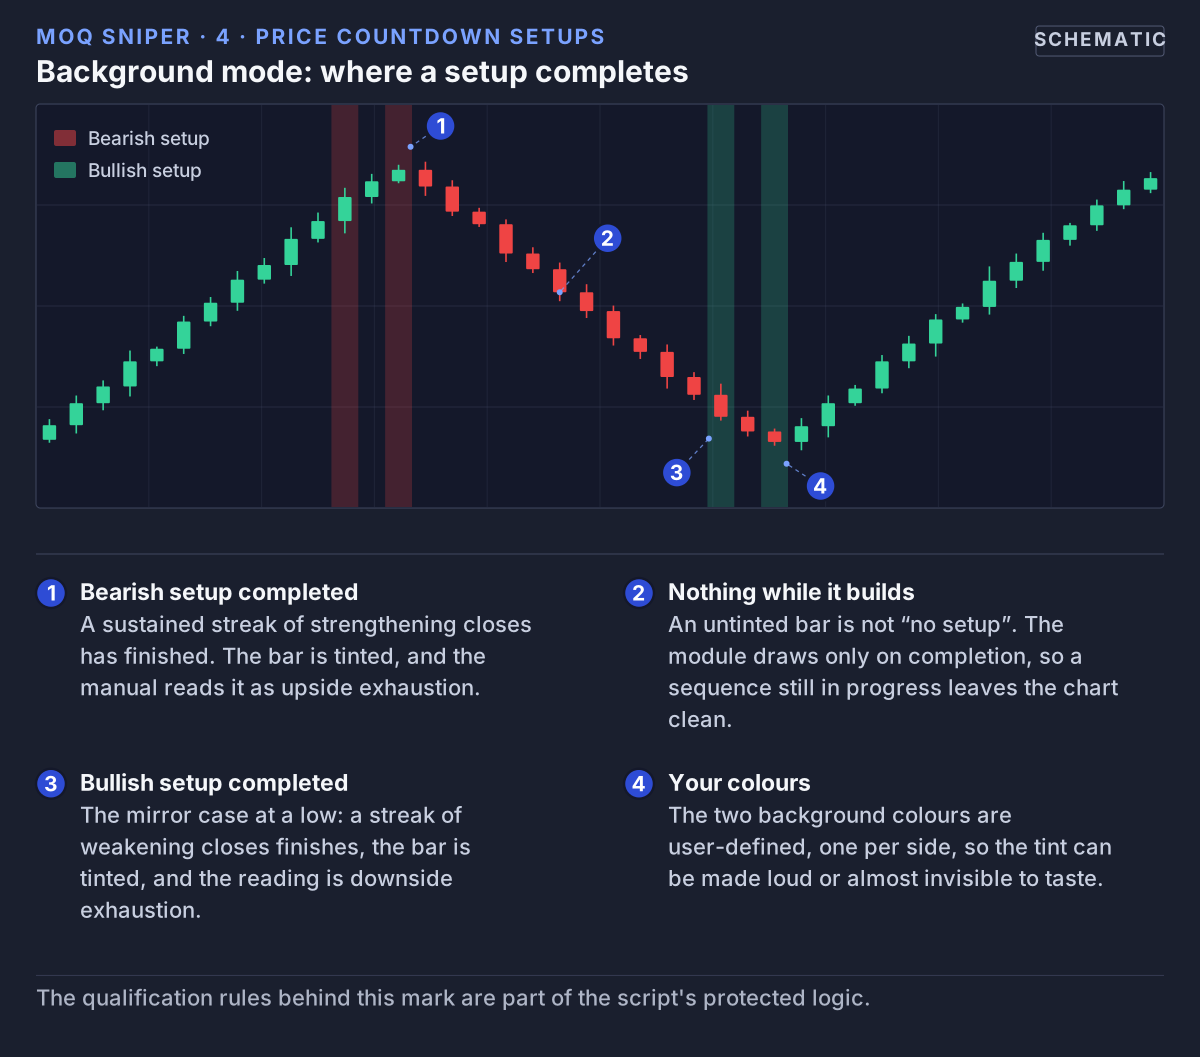 Background mode tints the bar on which a countdown setup completes: red for upside exhaustion, green for downside.
Shapes mode:
This helps you instantly spot exhaustion clusters that may precede reversals.
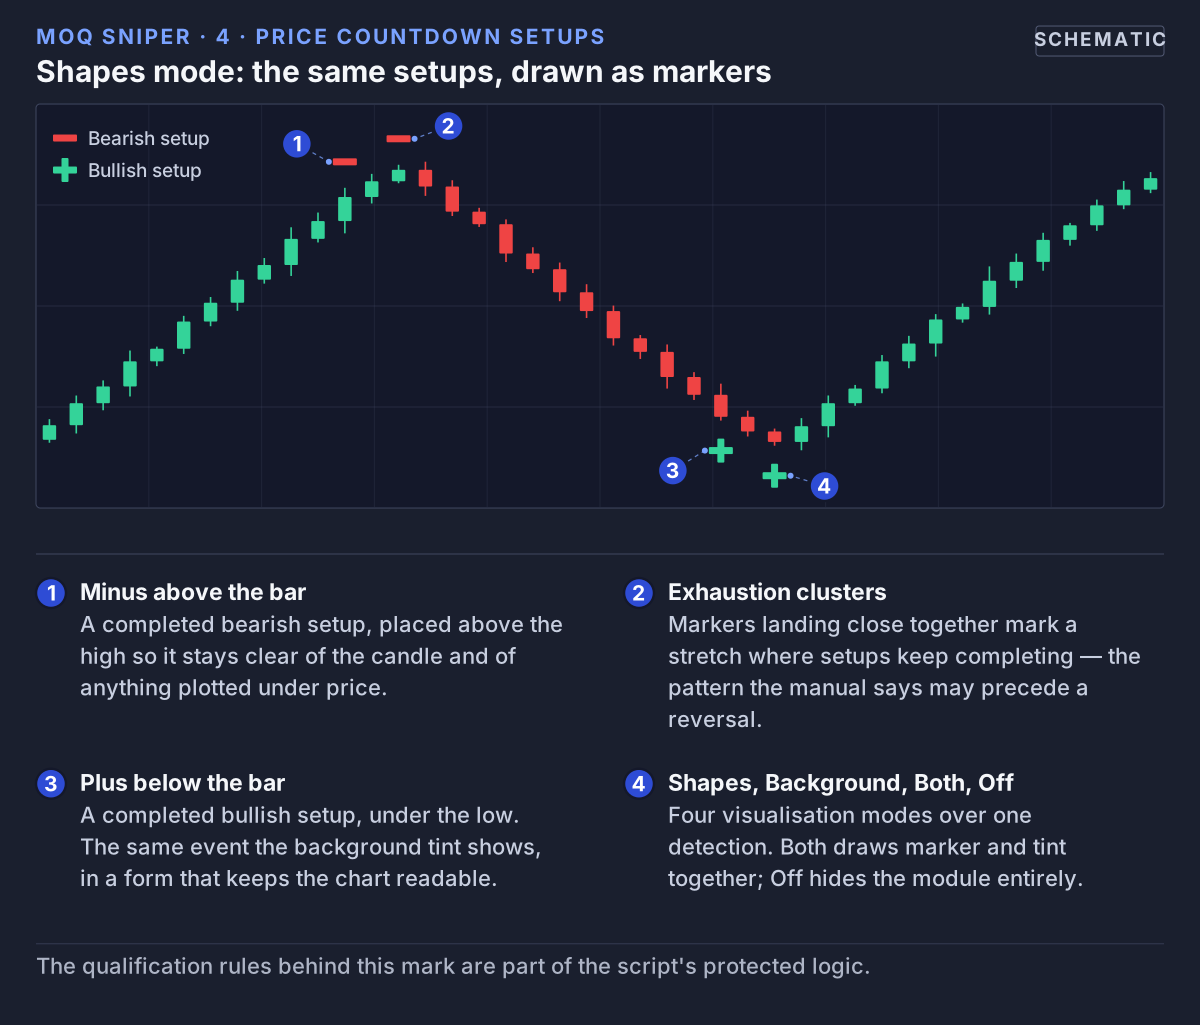 Shapes mode marks the identical bars with a minus above or a plus below, leaving the chart background clear.
5. Nadaraya-Watson Envelopes (Trend Model)
The core of Sniper. It applies a Nadaraya-Watson kernel regression to smooth price and draws adaptive envelopes based on volatility.
Main Components
- Smoothed NW Line – fair-value estimate of price
- Upper and Lower Envelopes – dynamic overbought/oversold zones
- Fill Between Bands – optional shaded trend channel
- Dynamic Trend Coloring – slope-based (lime = up, red = down)
- Bar Re-Coloring (Optional) – color candles by NW trend
1. Smoothed NW Line
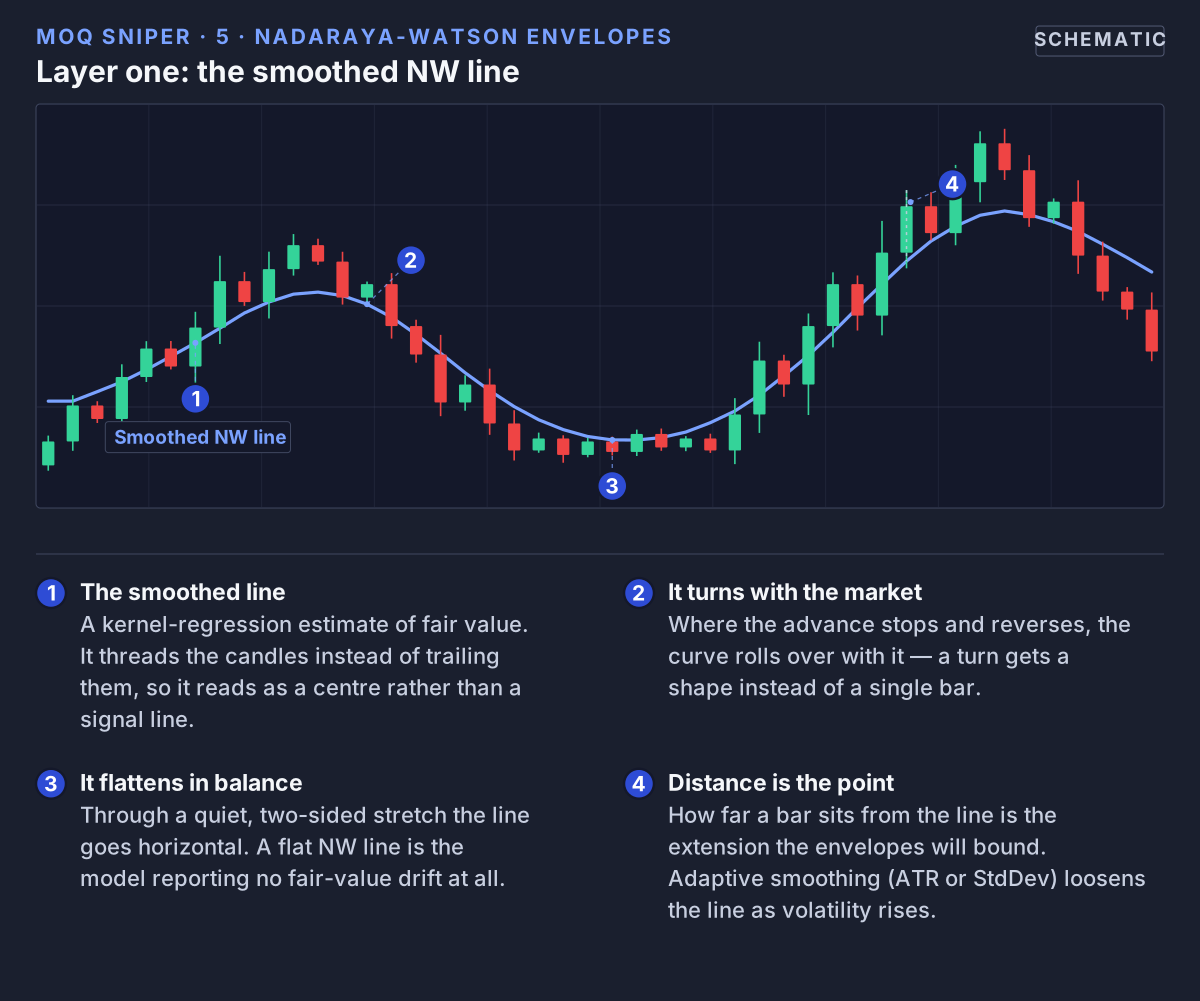 The smoothed Nadaraya-Watson line is a fair-value estimate of price — the reference every other part of the model is measured from.
2. Upper and Lower Envelopes
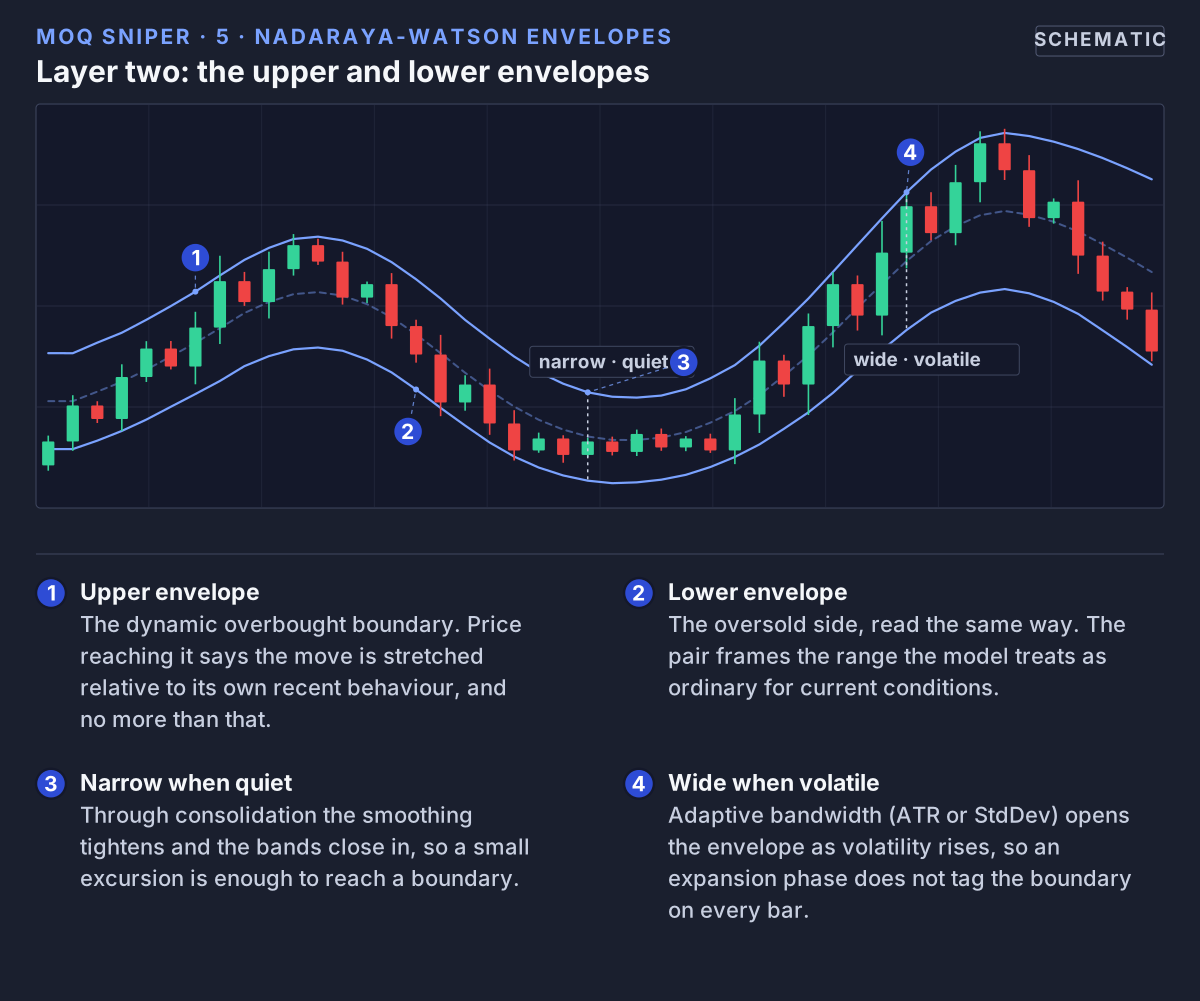 Layer two: envelopes above and below the line mark where price is statistically stretched, and their width tracks volatility.
3 & 4. Fill Between Bands & Dynamic Trend Coloring
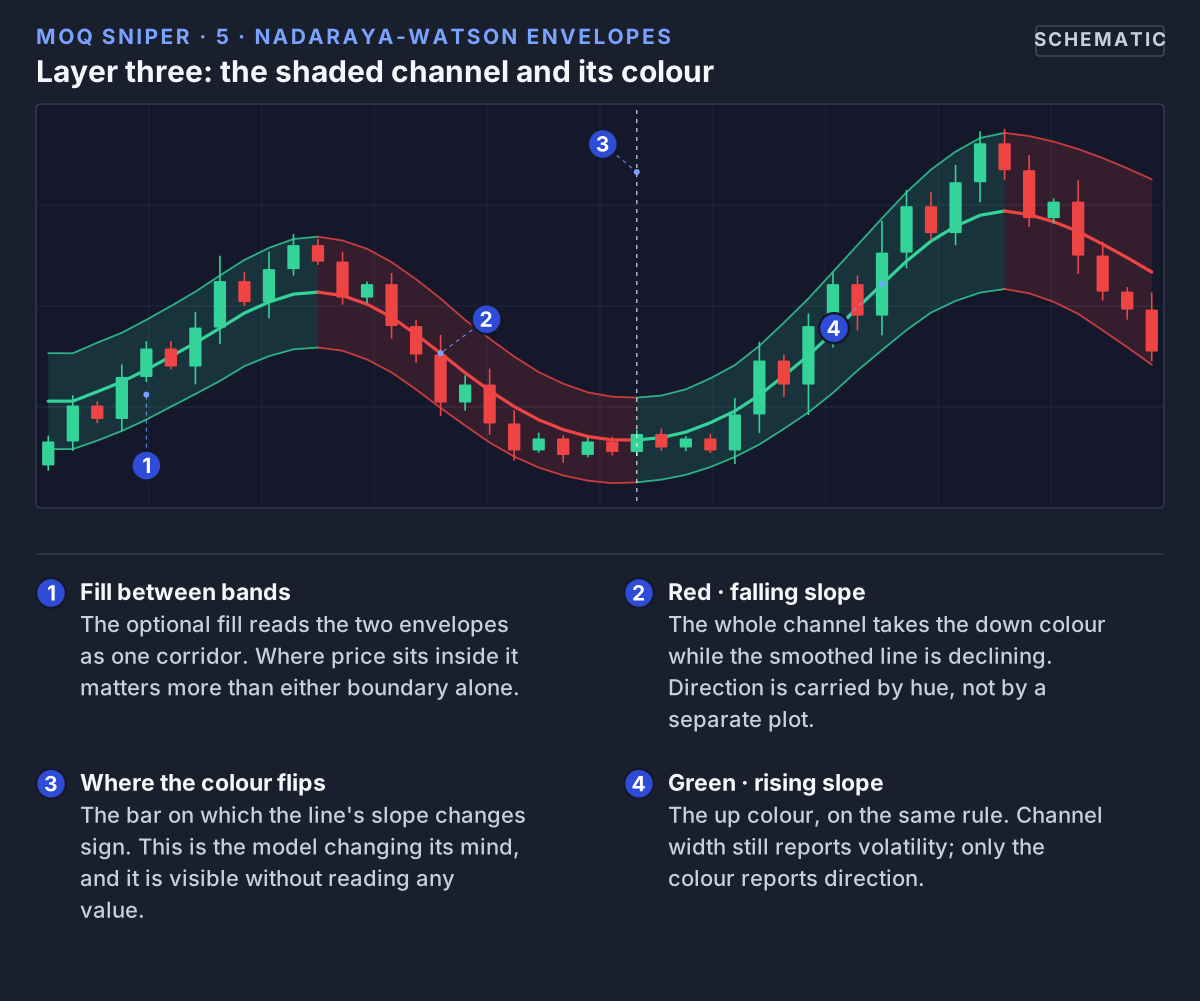 Layer three: filling between the bands turns the envelopes into one channel, and slope decides its colour — green rising, red falling.
5. Bar Re-Coloring
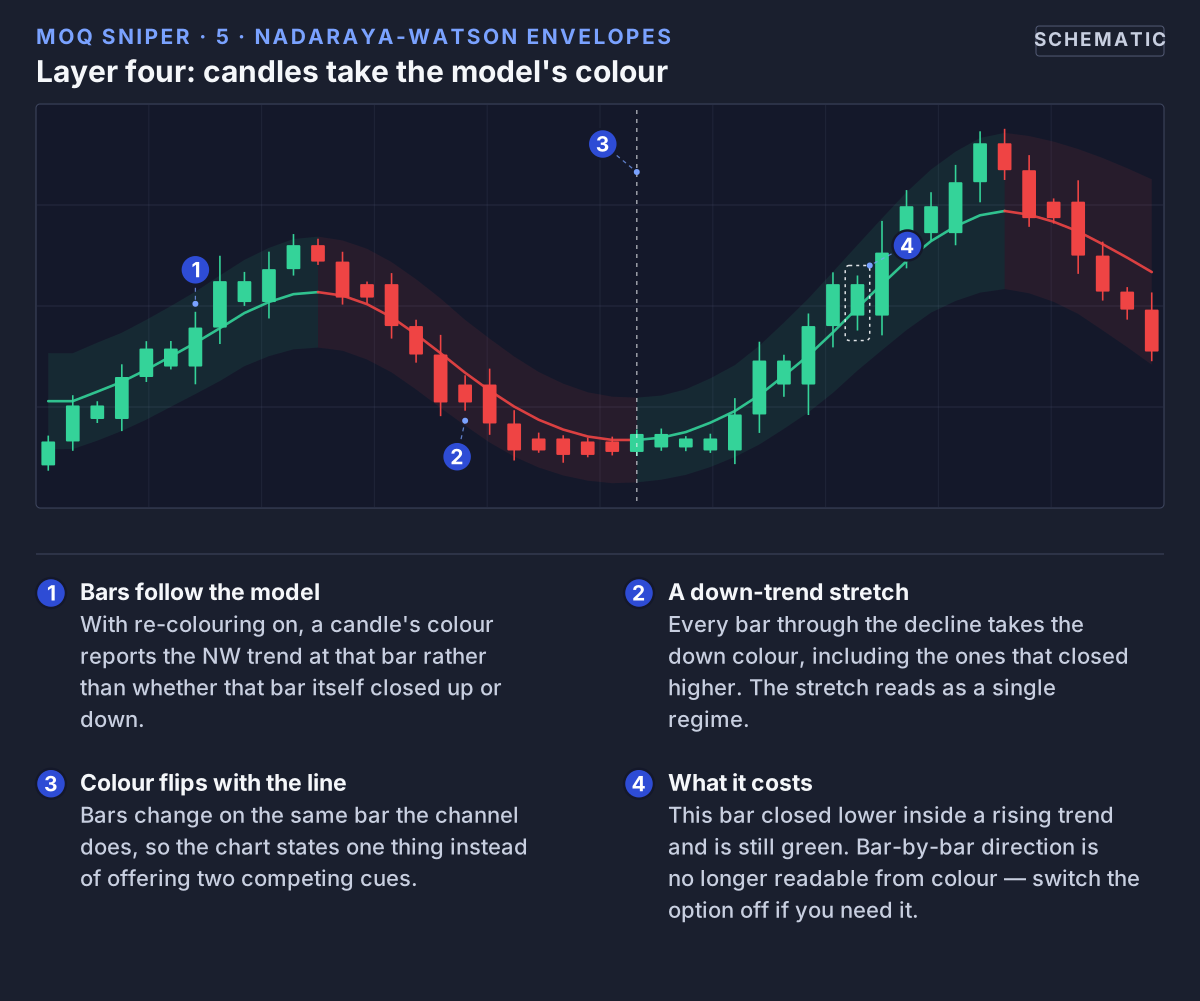 Layer four: bar re-colouring paints every candle with the model's direction, so the chart carries one opinion instead of two.
Adaptive Bandwidth
The smoothing reacts to volatility using ATR or Standard Deviation. When volatility rises, the bandwidth expands; when it contracts, smoothing tightens.
You can control:
- Adapt Mode: ATR or StdDev
- Adapt Strength: sensitivity
- Adapt Lookback: period for baseline
Higher Timeframe Mode
You can compute the entire NW model using a higher timeframe source (e.g., 4H data on a 15m chart). This produces a higher-level directional channel useful for lower-timeframe execution.
Mini-Dashboard
A small table (top-right corner) displays:
- "UP" = positive slope
- "DOWN" = negative slope
This quick visual cue gives you instant trend bias.
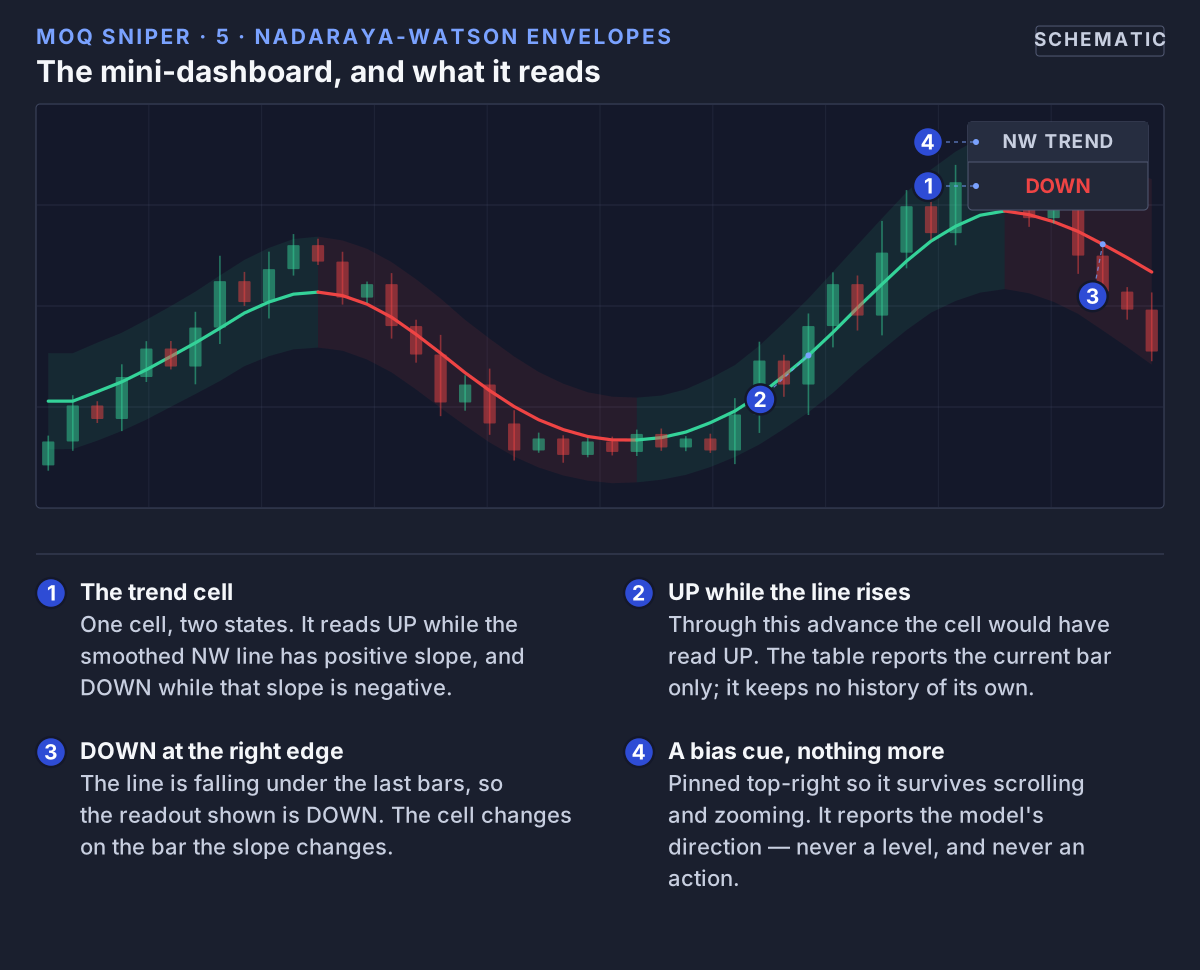 The mini-dashboard is a slope readout: UP while the smoothed line is rising, DOWN while it is falling.
6. NW Signals (Alerts & Markers)
When "Show Signals" is enabled, Sniper can mark events derived from the NW envelopes.
Modes
- Reversal Mode – price touches the outer envelope (potential reaction)
- Breakout Mode – price breaks through the envelope (potential continuation)
Reversal:
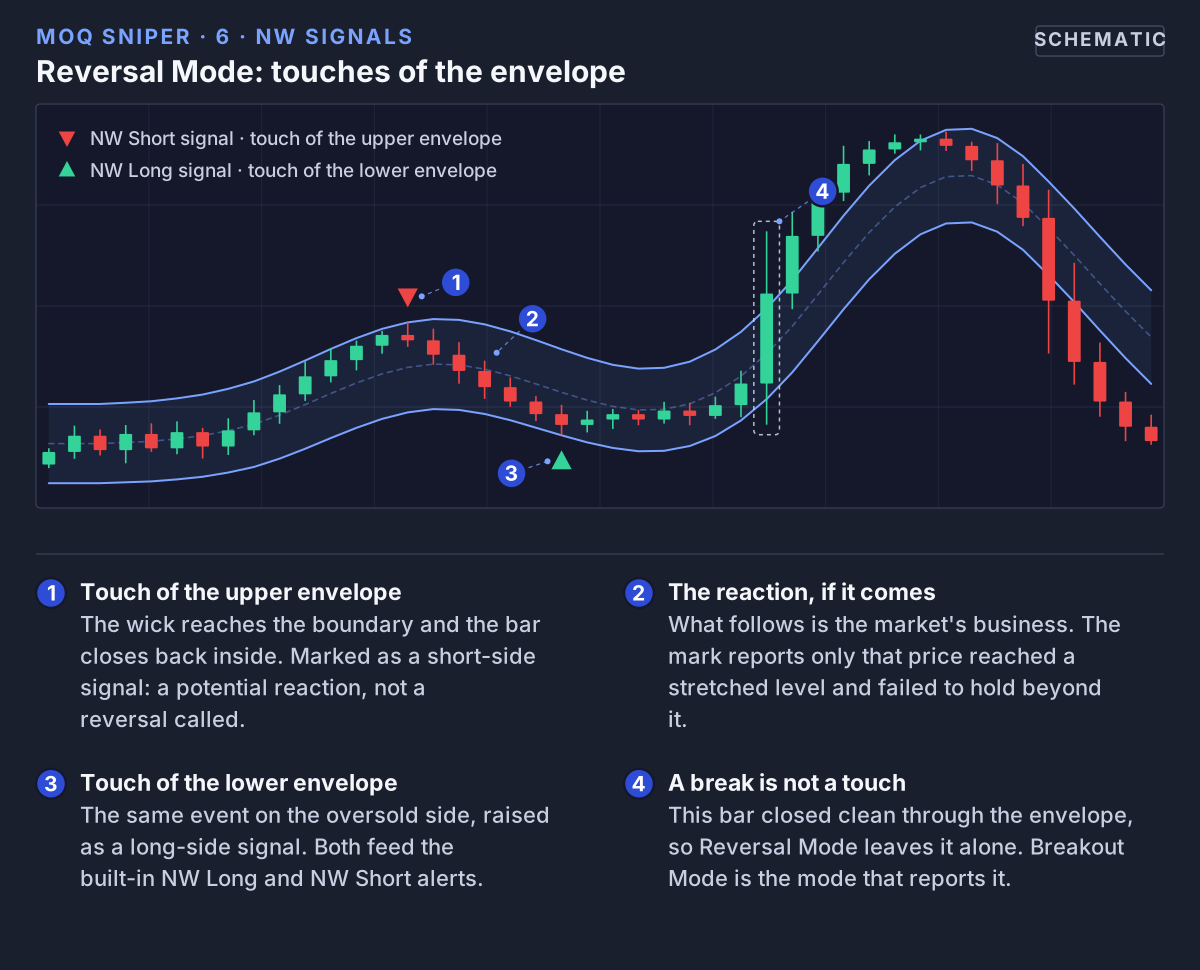 Reversal Mode marks bars that reach an envelope and turn back — a potential reaction at the boundary.
Breakout:
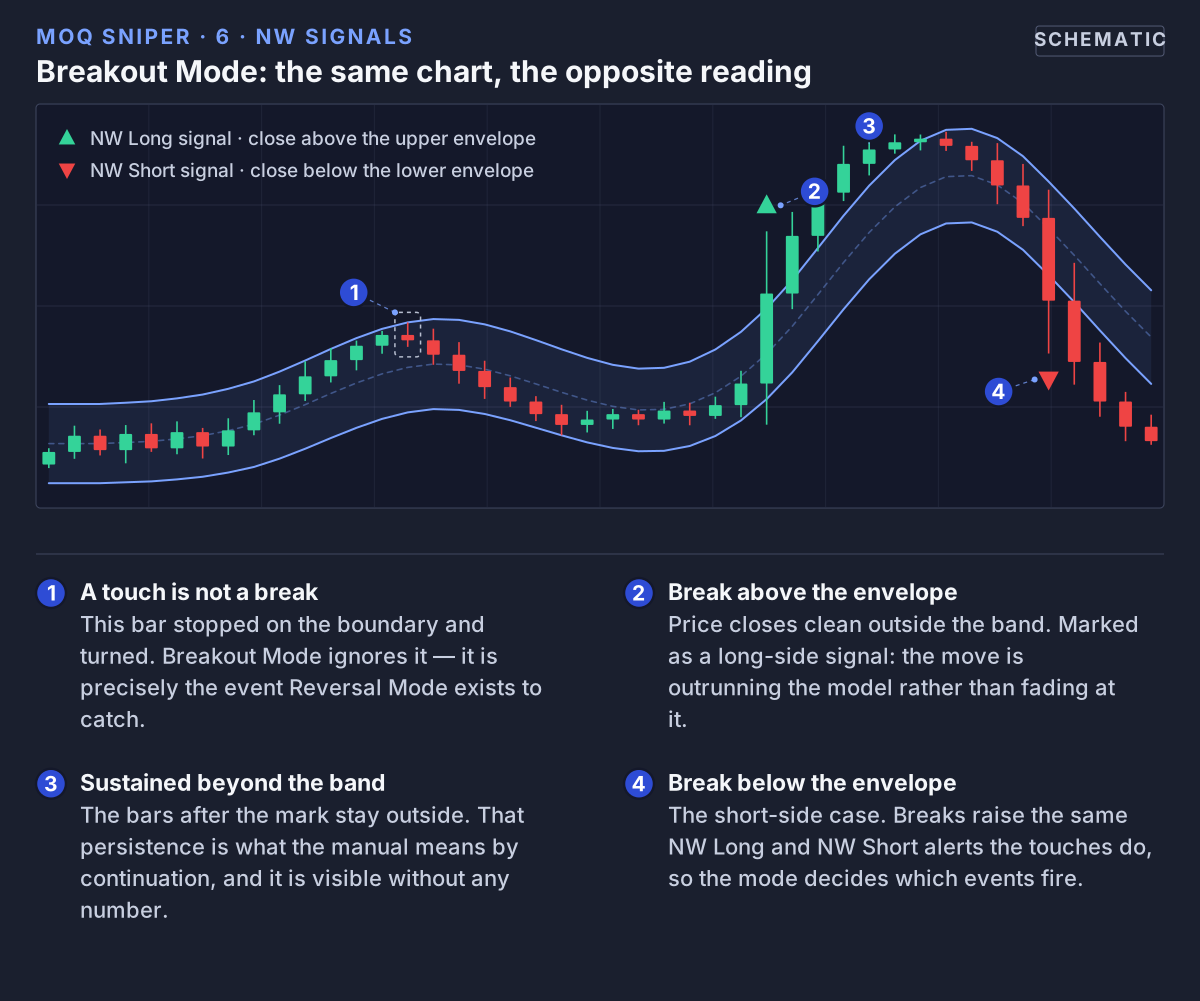 Breakout Mode marks bars that close through an envelope instead — read as continuation rather than reaction.
Alerts
Two built-in alert conditions:
- NW Long Signal – bullish touch or breakout
- NW Short Signal – bearish touch or breakout
You can attach TradingView alerts to receive notifications in real time.
7. Moving Averages Stack
A flexible framework of multiple MAs (5 → 325 periods) with individual visibility and type selection.
Configuration
For each period you can choose:
- SMA or EMA
- Custom color
- Show/hide toggle
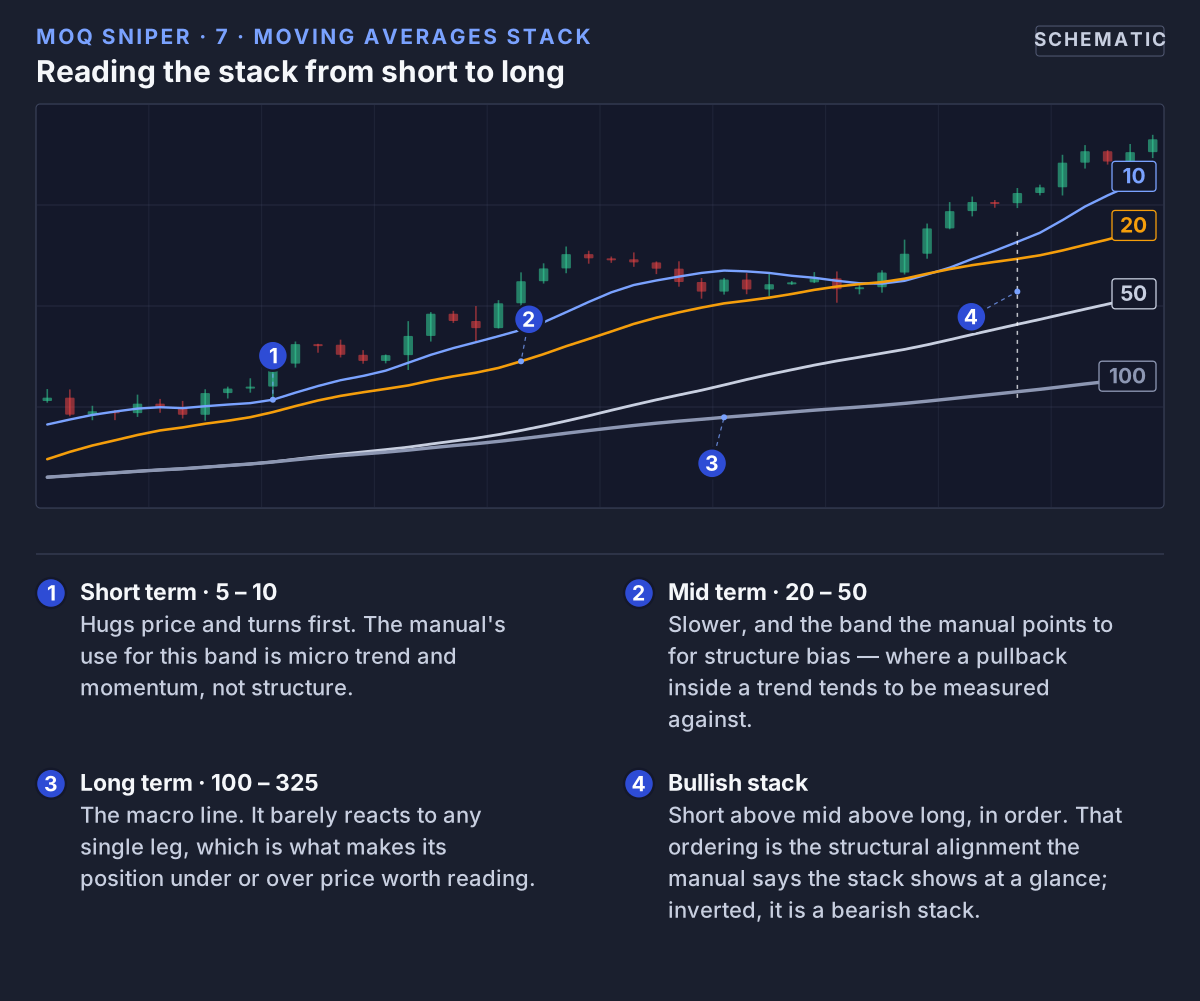 The stack runs from 5 to 325 periods with per-line type, colour and visibility; the order they sit in is the structural read.
Common Use Cases
- Short-term (5-10) → micro trend and momentum
- Mid-term (20-50) → structure bias
- Long-term (100-325) → macro direction
This helps visualize structural alignment (bullish stack vs bearish stack) at a glance.
8. OLS Regression Line
The Ordinary Least Squares (OLS) Regression module fits a linear trend line over a selected number of bars (default 15).
Options
- Show Regression Line – displays current slope
- Show Intercept Line – displays baseline level
Purpose: Measure near-term direction and strength. Detect acceleration or deceleration phases.
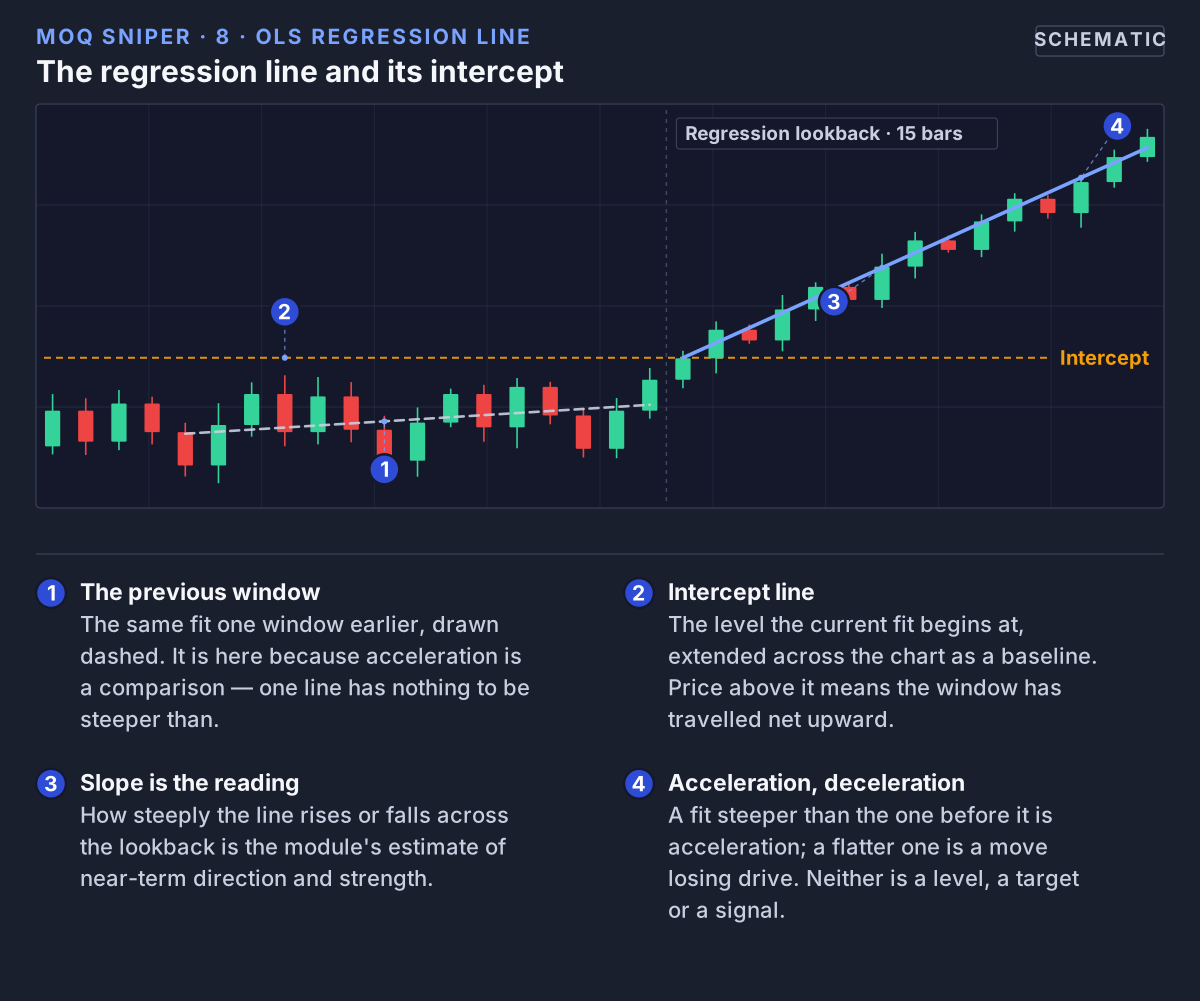 The OLS module fits a straight line over the lookback — 15 bars by default — and can draw the level it starts from as an intercept line.
9. Bollinger Bands Module
An optional overlay for traditional 20-period SMA ± 2 standard deviations. When enabled:
- Draws upper and lower bands.
- Optional color fill for quick volatility context.
This is a familiar complement to the adaptive NW model — allowing comparison between static and adaptive volatility zones.
10. Alerts Summary
Built-in alert conditions:
- Bullish Price Countdown – possible upward momentum
- Bearish Price Countdown – possible downward momentum
- NW Long Signal / Short Signal – interaction with envelopes
These alerts are optional and purely informational.
11. Best Practices
- After each update, remove and re-add the indicator to load new settings.
- Choose Dark / Light Mode first for consistent colors.
- For scalping or intraday trading:
- Enable NW Envelopes + Adaptive Bandwidth.
- Enable Price Countdown.
- Use short MAs (8–30).
- For swing or positional work:
- Focus on higher timeframe NW trend and long MAs (50–325).
- Disable extra signals for clarity.
12. Legal Disclaimer
The MomentumQ Sniper indicator and this documentation are provided for educational and informational purposes only. They do not constitute financial advice, investment recommendations, or an offer to buy or sell any financial instrument.
Trading involves substantial risk. Past performance is not indicative of future results. Users are solely responsible for their own decisions and should consult a licensed financial advisor before acting on any analysis.
The MomentumQ Sniper script is proprietary to MomentumQ GmbH and provided for personal, non-transferable use under the MomentumQ Terms of Service; redistribution, modification, and source extraction are prohibited.
© MomentumQ GmbH. All rights reserved.