Version: V4.2 · License: proprietary — MomentumQ GmbH · © MomentumQ GmbH
1. Overview
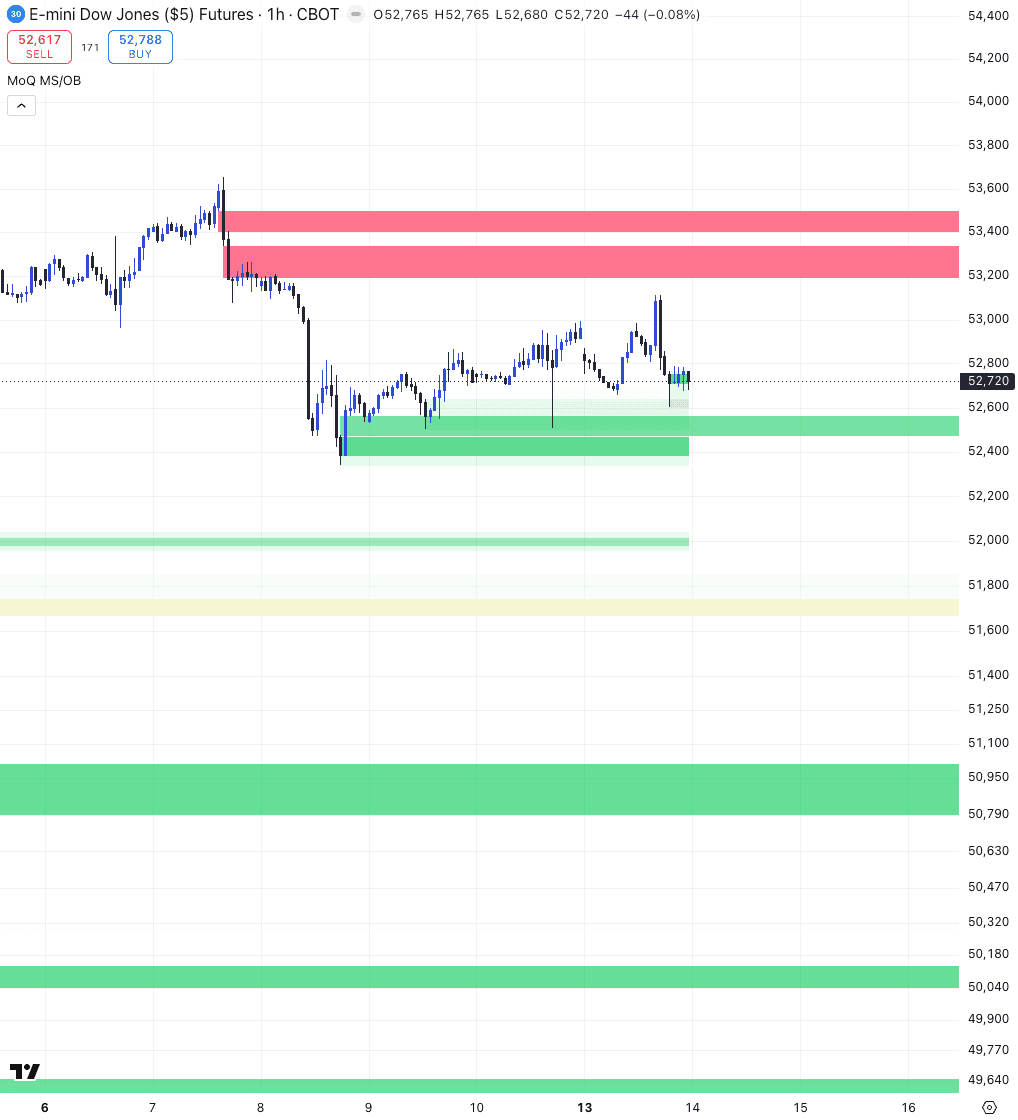
MomentumQ MS/OB is a professional TradingView indicator designed to simplify Smart Money Concepts (SMC) analysis.
It automatically detects and visualizes Order Blocks, Fair Value Gaps (FVGs), price gaps, and key market levels — helping traders interpret structure, liquidity, and potential reaction zones in real time.
Core Features
- Order Block detection (bullish & bearish)
- Fair Value Gap (FVG) scanner with automatic extension
- Price Gap detection with auto-fill tracking
- Multi-timeframe zones (see HTF structure inside LTF charts)
- Previous Day / Week / Month levels
- Auto Fibonacci retracements & extensions
- Dark & Light mode support
This tool does not generate buy/sell signals. It visualizes market structure and liquidity concepts to assist discretionary traders.
2. Display Modes & Appearance
Dark Mode / Light Mode
This setting adjusts text and line colors for optimal readability. Choose between Dark Mode and Light Mode to match your TradingView theme.
Use MoQ Settings
Enable "Use MoQ Settings" to apply MomentumQ's default style configuration (standardized colors and transparencies).
Disable it to fully customize all color settings manually.
3. Order Blocks
To enable automatic order block detection, click on the checkboxes as shown below:
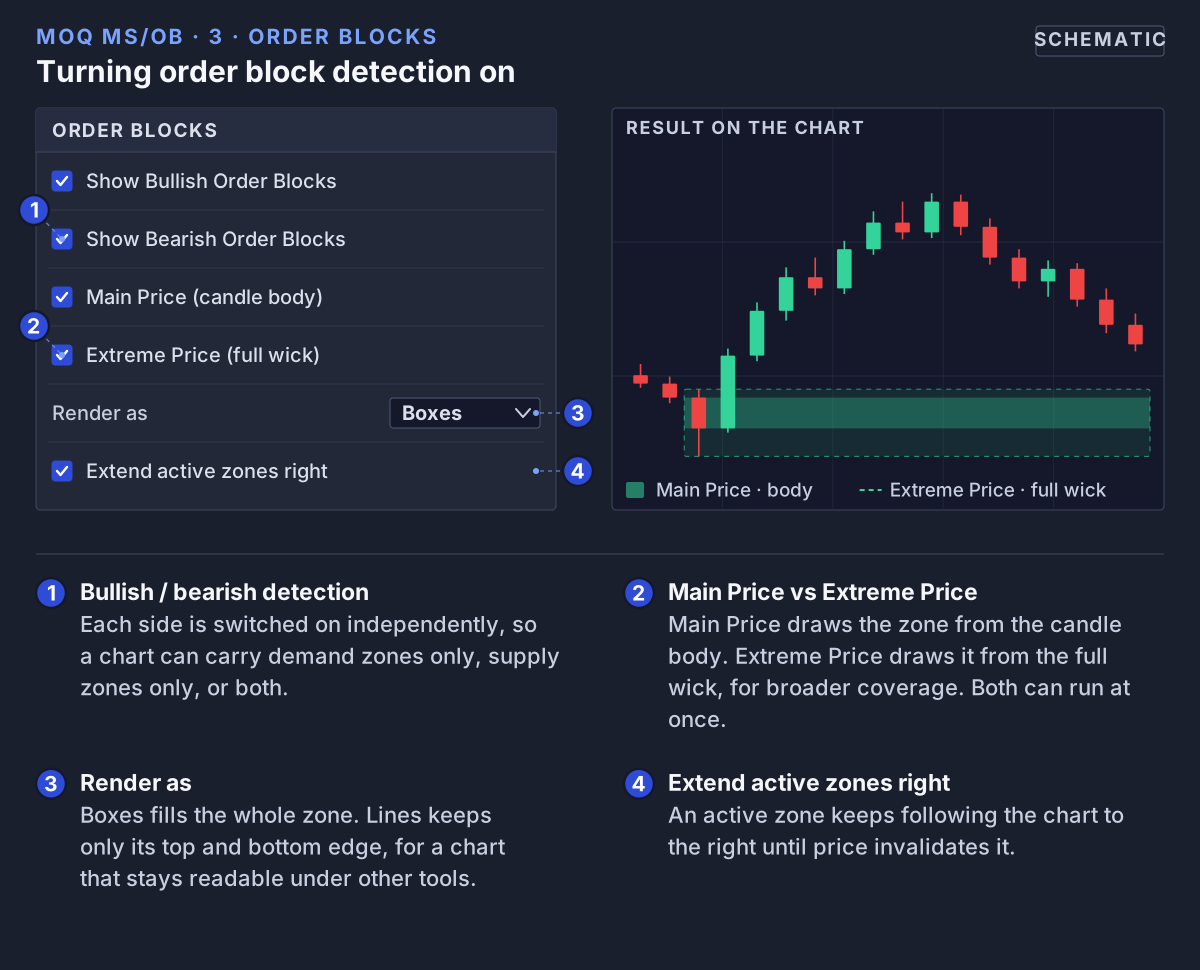 Order block detection: what each toggle switches on, and how it changes the zone drawn on the chart.
What They Represent
- Bullish Order Block: Last bearish candle before a bullish impulse.
- Bearish Order Block: Last bullish candle before a bearish impulse.
These areas often mark institutional demand (support) or supply (resistance) zones.
Visualization
- Bullish zones → green boxes
- Bearish zones → red boxes
- Boxes extend rightward as long as the zone remains active.
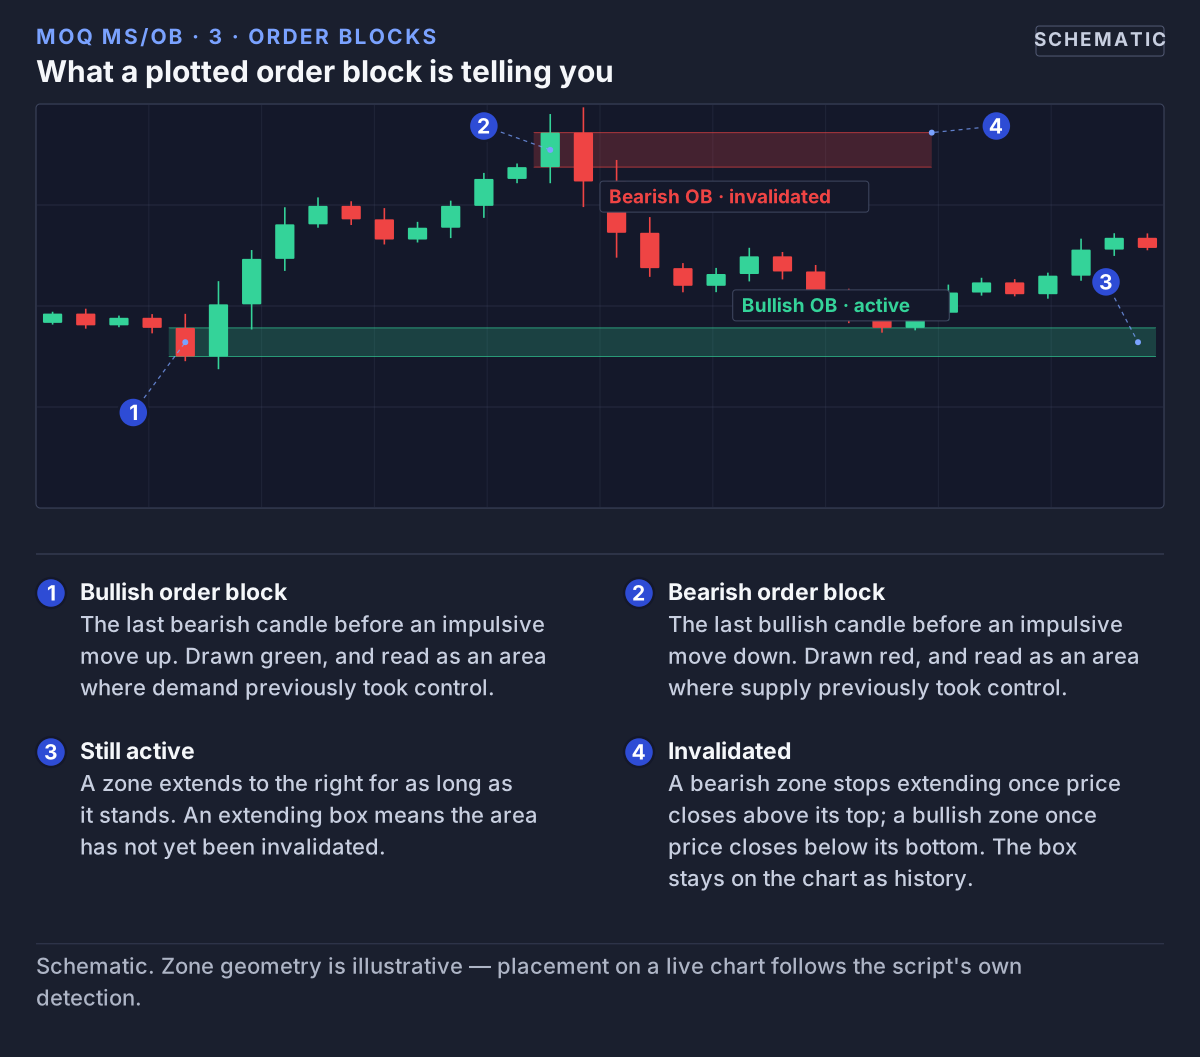 A bullish and a bearish order block, from the candle that forms them to the close that stops one extending.
Zone Deactivation
- Bearish OB → becomes inactive if price closes above its top.
- Bullish OB → becomes inactive if price closes below its bottom.
Once invalidated, the box remains as historical context but stops extending.
Main Price vs. Extreme Price
- Main Price: Uses candle body (open/close) for refined OB range.
- Extreme Price: Uses full wick (high/low) for broader coverage.
You can display both simultaneously for more context.
Render Options
You can toggle:
- Boxes: filled areas (default)
- Lines: top/bottom boundaries only (minimalist view)
Each style can be separately customized for bullish and bearish blocks.
4. Multi-Timeframe Order Blocks
MomentumQ MS/OB supports up to three higher-timeframe overlays.
Example: view 4H and 1H Order Blocks directly within a 15-minute chart.
Each timeframe has its own enable toggle and label.
This helps identify confluences between intraday structure and higher timeframe zones — a key principle in SMC trading.
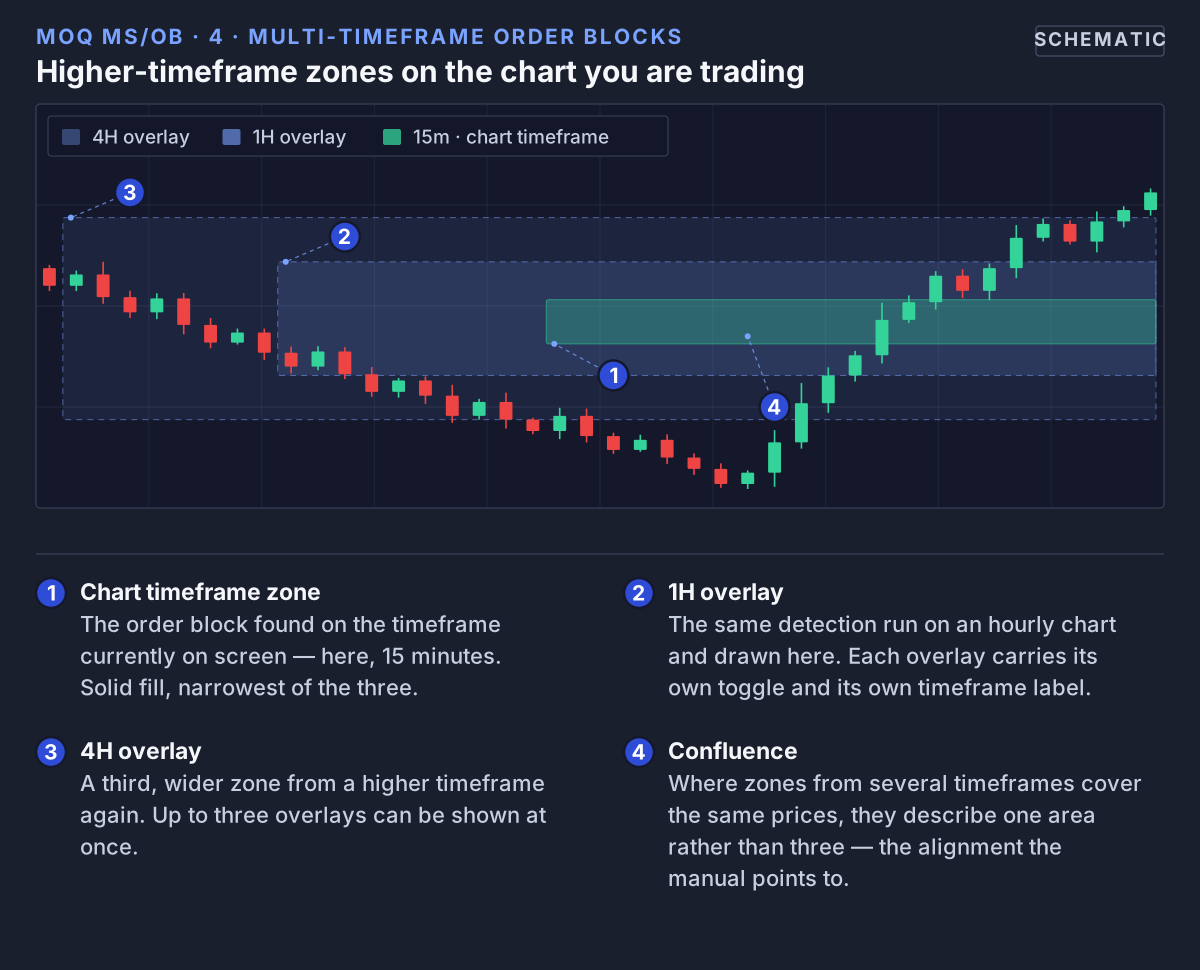 Up to three higher-timeframe zones can sit on the current chart. Where they overlap is the confluence the manual describes.
5. Fair Value Gaps (FVGs)
Definition
An FVG (Fair Value Gap) is an inefficiency created when price moves so rapidly that it leaves untraded space between candles.
Detection Logic
- Bullish FVG: An aggressive up-move leaves untraded space below current price.
- Bearish FVG: An aggressive down-move leaves untraded space above current price.
Detection is based on a refined multi-candle imbalance model with internal filtering to reduce noise — the exact qualification rules are part of the script's protected logic.
Auto-Extension
Enable "Extend Unfilled FVGs to Right" to visually track live, unfilled imbalances.
When price fills an FVG (touches its opposite boundary), the box stops extending automatically.
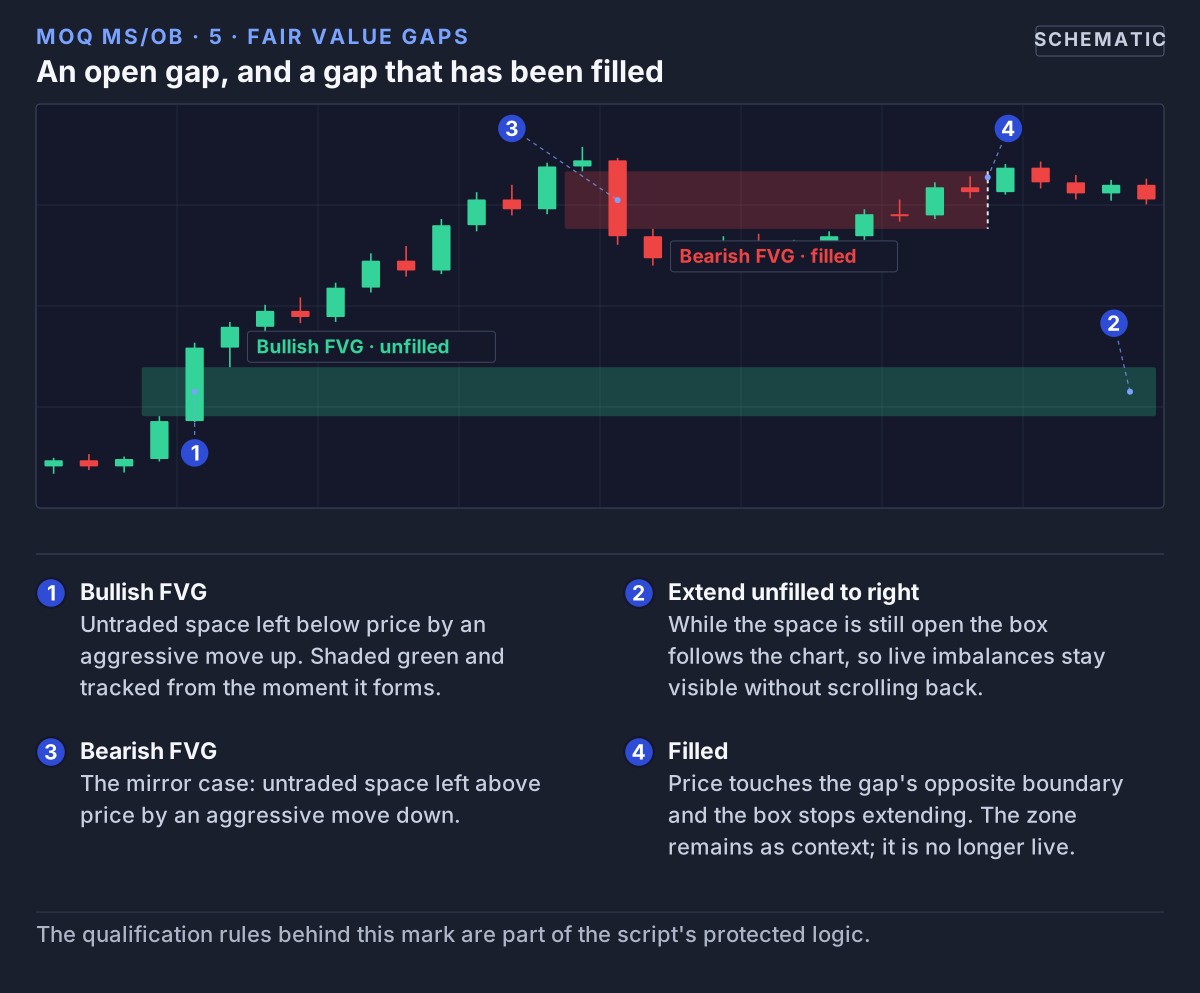 A fair value gap marks untraded space left by a fast move. It extends right while it is open and stops when price fills it.
Multi-Timeframe FVGs
Display up to 3 higher-timeframe FVGs (e.g., "4H FVG" or "1D FVG") on your current chart.
Each FVG is labeled by timeframe for clarity.
6. Price Gap Scanner
The Gap Scanner identifies opening gaps between consecutive candles.
Logic
- Bullish gap: The market opens fully above the previous candle's range.
- Bearish gap: The market opens fully below the previous candle's range.
Visualization
Each gap is drawn as a box that extends rightward until filled. When price returns into the gap zone, it stops extending automatically.
This helps traders quickly identify unfinished price business or liquidity voids.
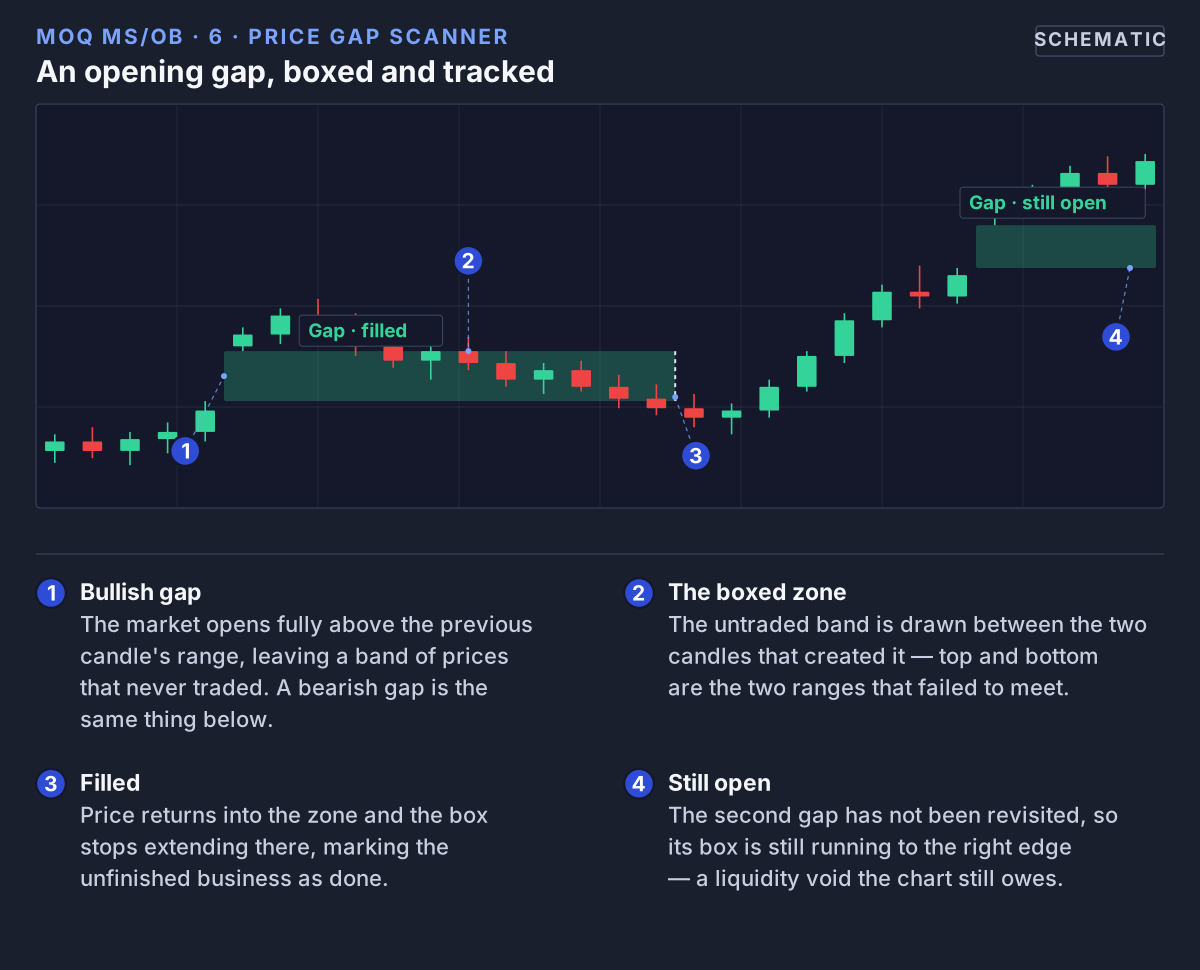 The gap scanner boxes an opening gap between consecutive candles and tracks it until price returns.
7. Key Levels
MomentumQ MS/OB can display major reference levels:
- Previous Day, Week, and Month Highs and Lows
These are critical for spotting:
- Liquidity sweeps
- Range boundaries
- Potential reversal areas
Each can be toggled on/off individually.
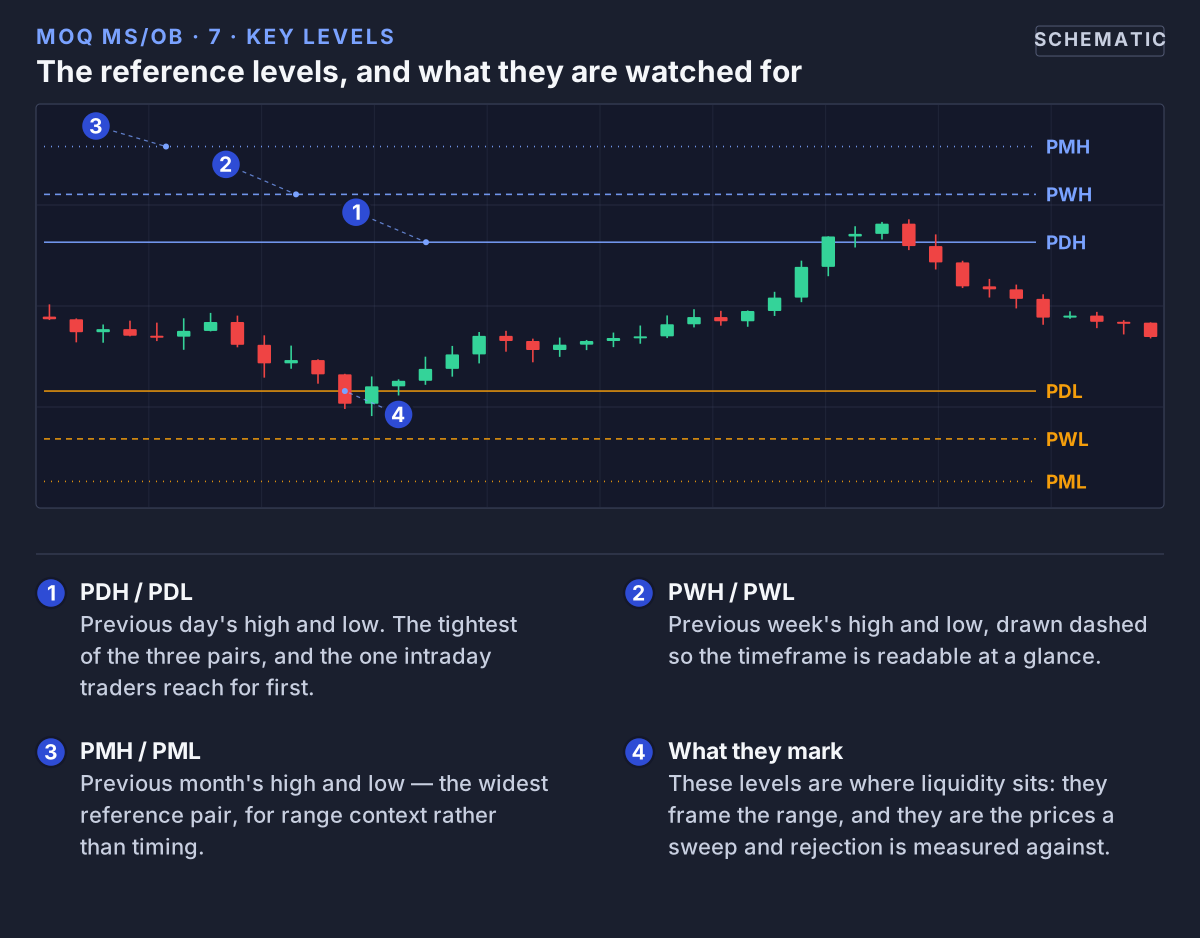 Previous day, week and month highs and lows, each individually toggleable, drawn as reference levels.
8. Auto Fibonacci Levels
Function
Automatically plots Fibonacci retracements and extensions between the most recent confirmed swing high and swing low.
Features
- Standard retracements (0.236 → 1.0)
- Optional extensions (1.272, 1.618, 2.0)
- Dynamic updates when new swings form
- Optional ratio labels
- Fully customizable colors, widths, and visibility
This replaces manual fib drawing and updates automatically as market structure evolves.
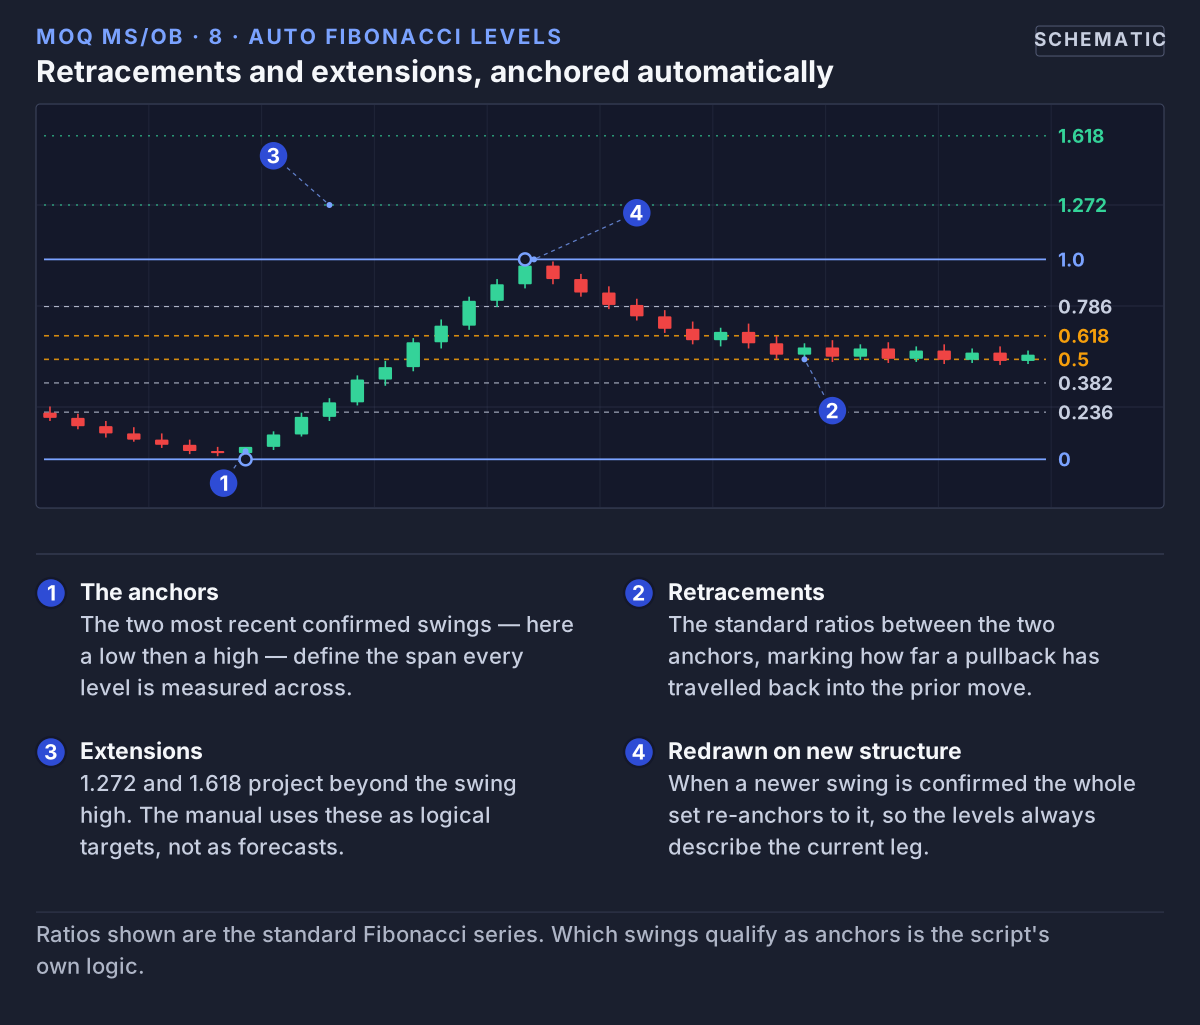 Retracements are anchored to the two most recent confirmed swings and redrawn whenever new structure forms.
9. Line Aging / Cleanup
For order block boundary lines, you can define an automatic removal time in months (1–12).
Old lines are deleted after expiry to keep your chart clean. Visual boxes remain intact for historical reference.
10. Recommended Workflow
- Identify Bias
Use higher timeframe order blocks and FVGs to define directional bias.
- Mark Liquidity Zones
Observe previous day/week/month highs and lows. Watch for sweeps and rejections.
- Execution
Wait for price to reach an active OB, FVG, or gap. Monitor lower-timeframe reaction and structure shift.
- Targets
Use unfilled FVGs, gaps, or Fibonacci extensions as logical targets.
This tool supports analysis. It is not a trading signal system and does not provide financial advice.
11. Best Practices
- After updating to a new version, remove and re-add the indicator to reload new settings.
- Choose your preferred visual mode before customizing colors.
- For scalping or intraday use:
- Enable higher-timeframe zones (e.g., 1H / 4H)
- Enable FVG & Gap extension
- Turn on Previous Day Levels
- For higher timeframe analysis:
- Disable smaller tools (like gap extension) for a cleaner view.
12. Legal Disclaimer
This indicator and its associated documentation are provided for educational and informational purposes only. It does not constitute financial advice, trading recommendations, or an offer to buy or sell any financial instrument.
All trading involves risk. You are solely responsible for your investment decisions and should consult a licensed financial advisor before acting on any analysis.
The MomentumQ MS/OB script and all related materials are proprietary to MomentumQ GmbH and provided for personal, non-transferable use under the MomentumQ Terms of Service; redistribution, modification, and source extraction are prohibited.
© MomentumQ GmbH. All rights reserved.